Category: Entrepreneurship

US Investment Activity by State from 2001

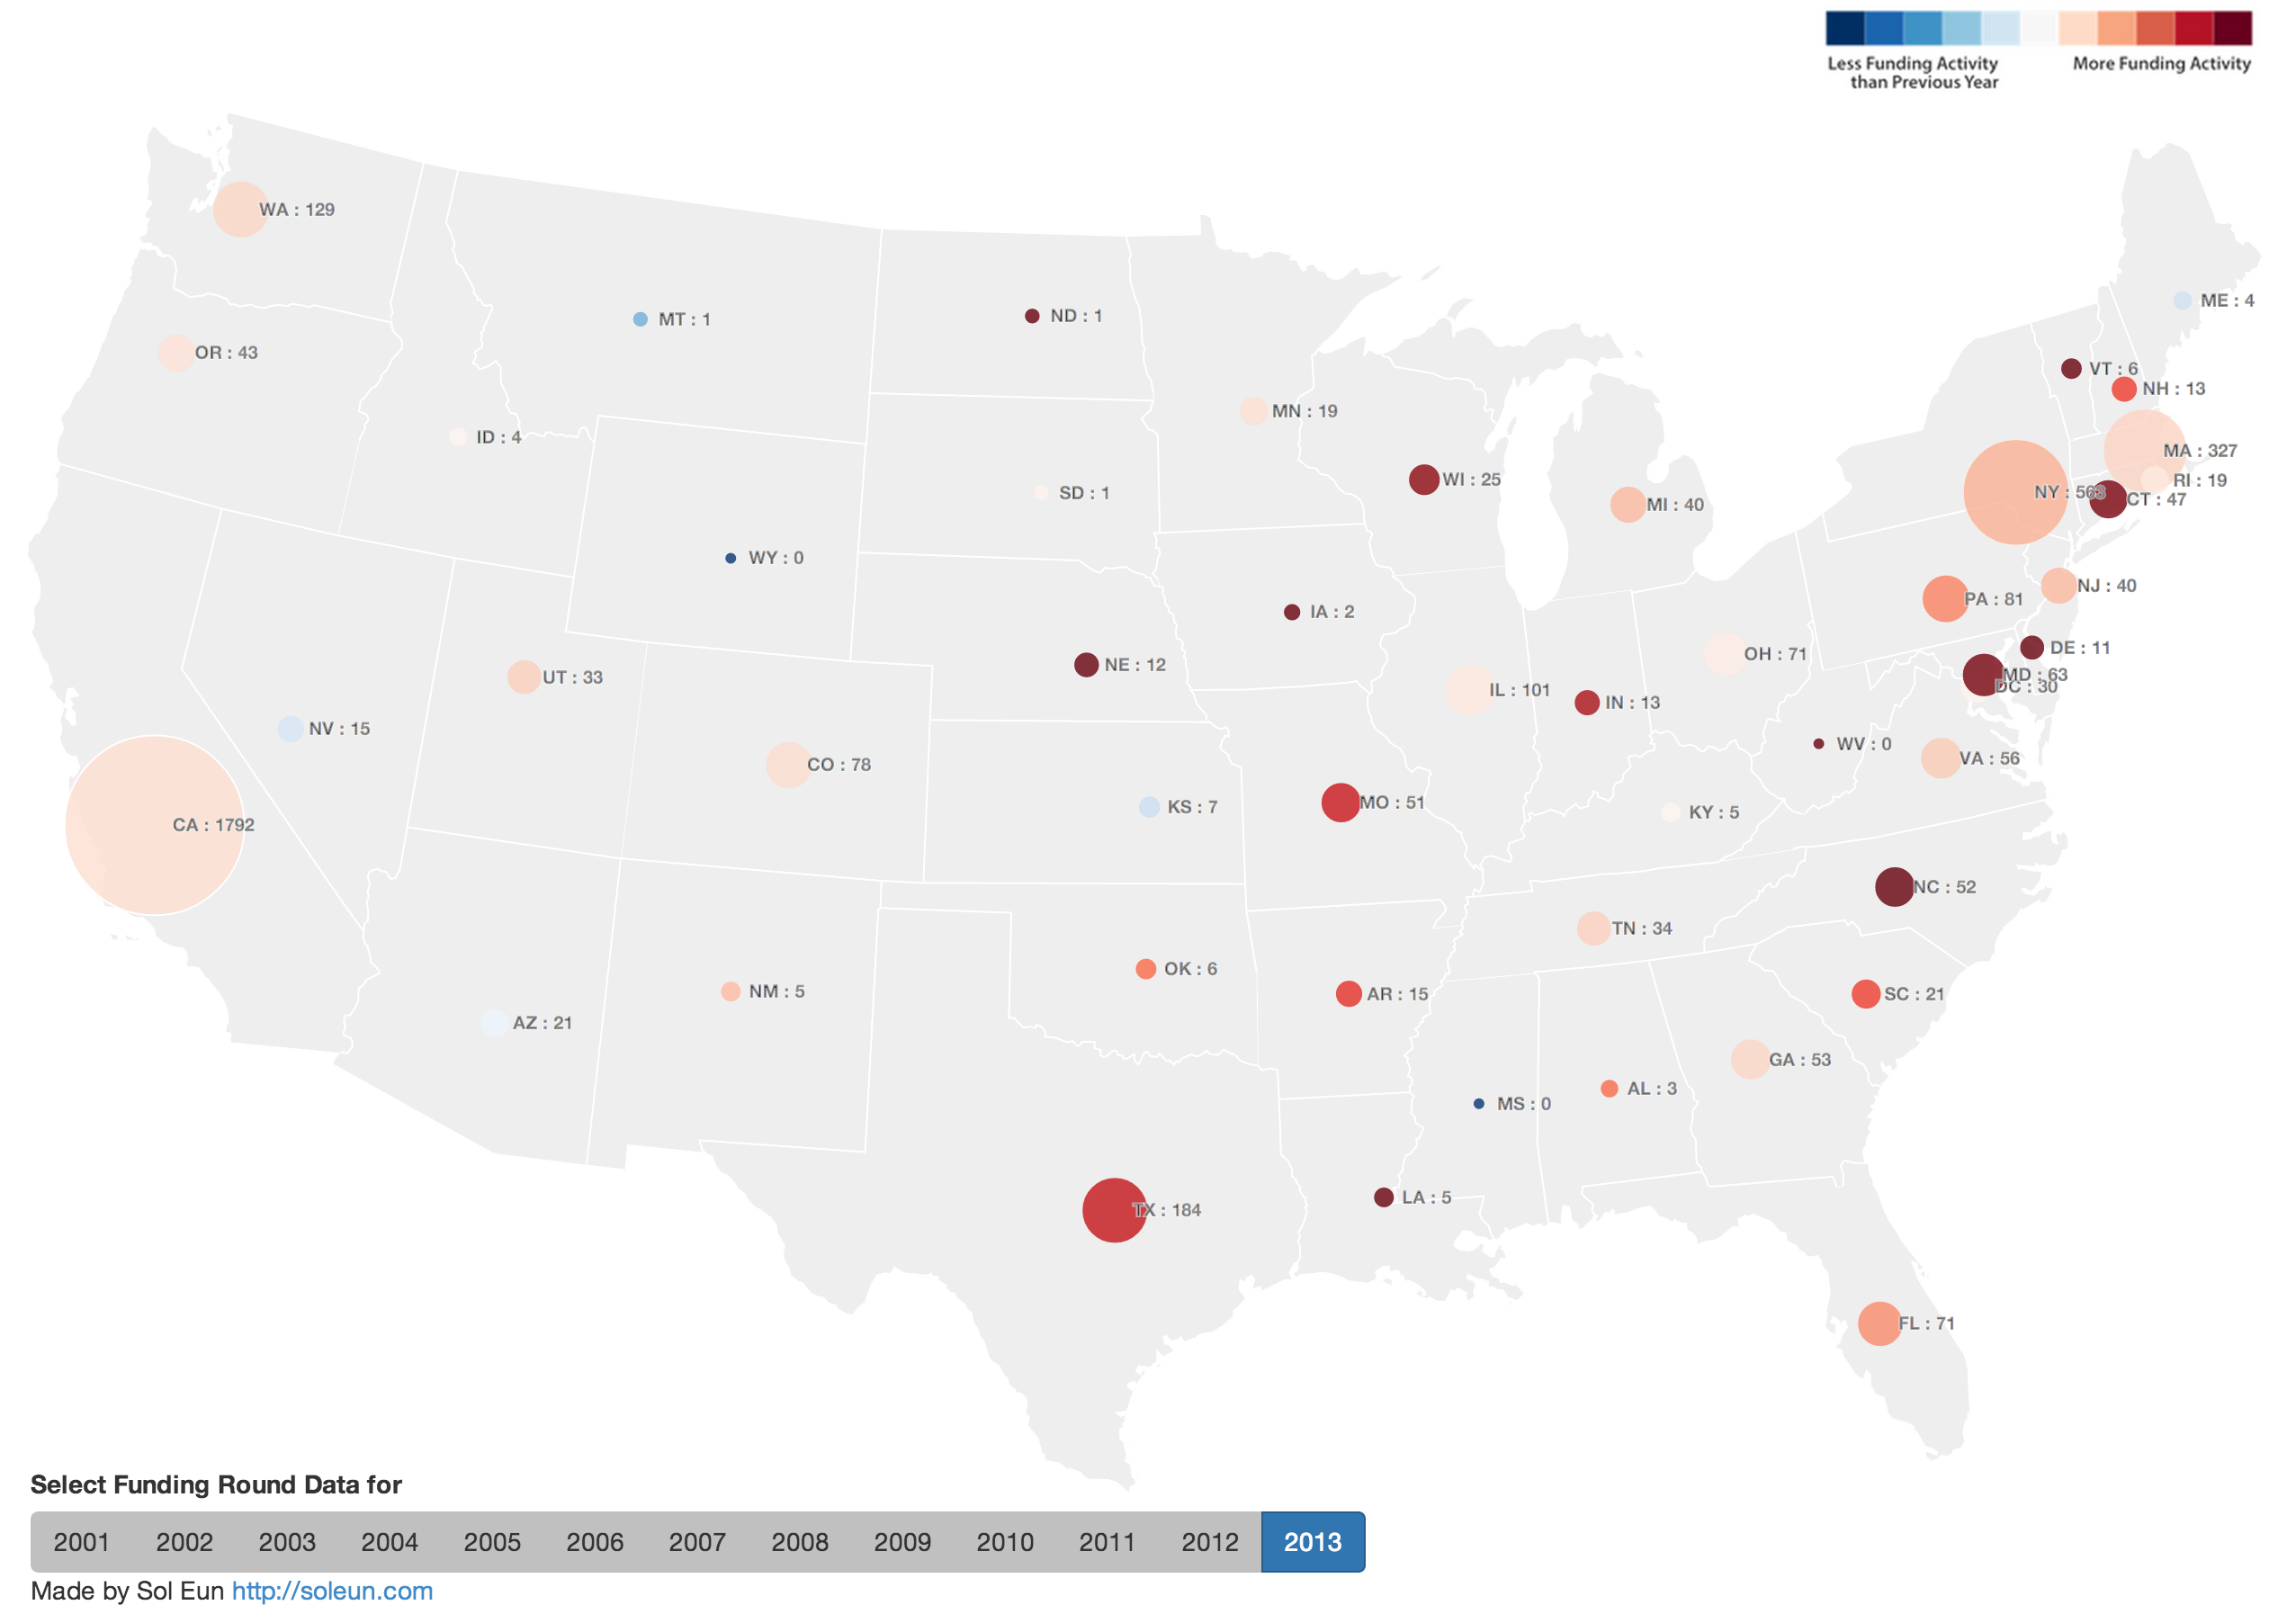
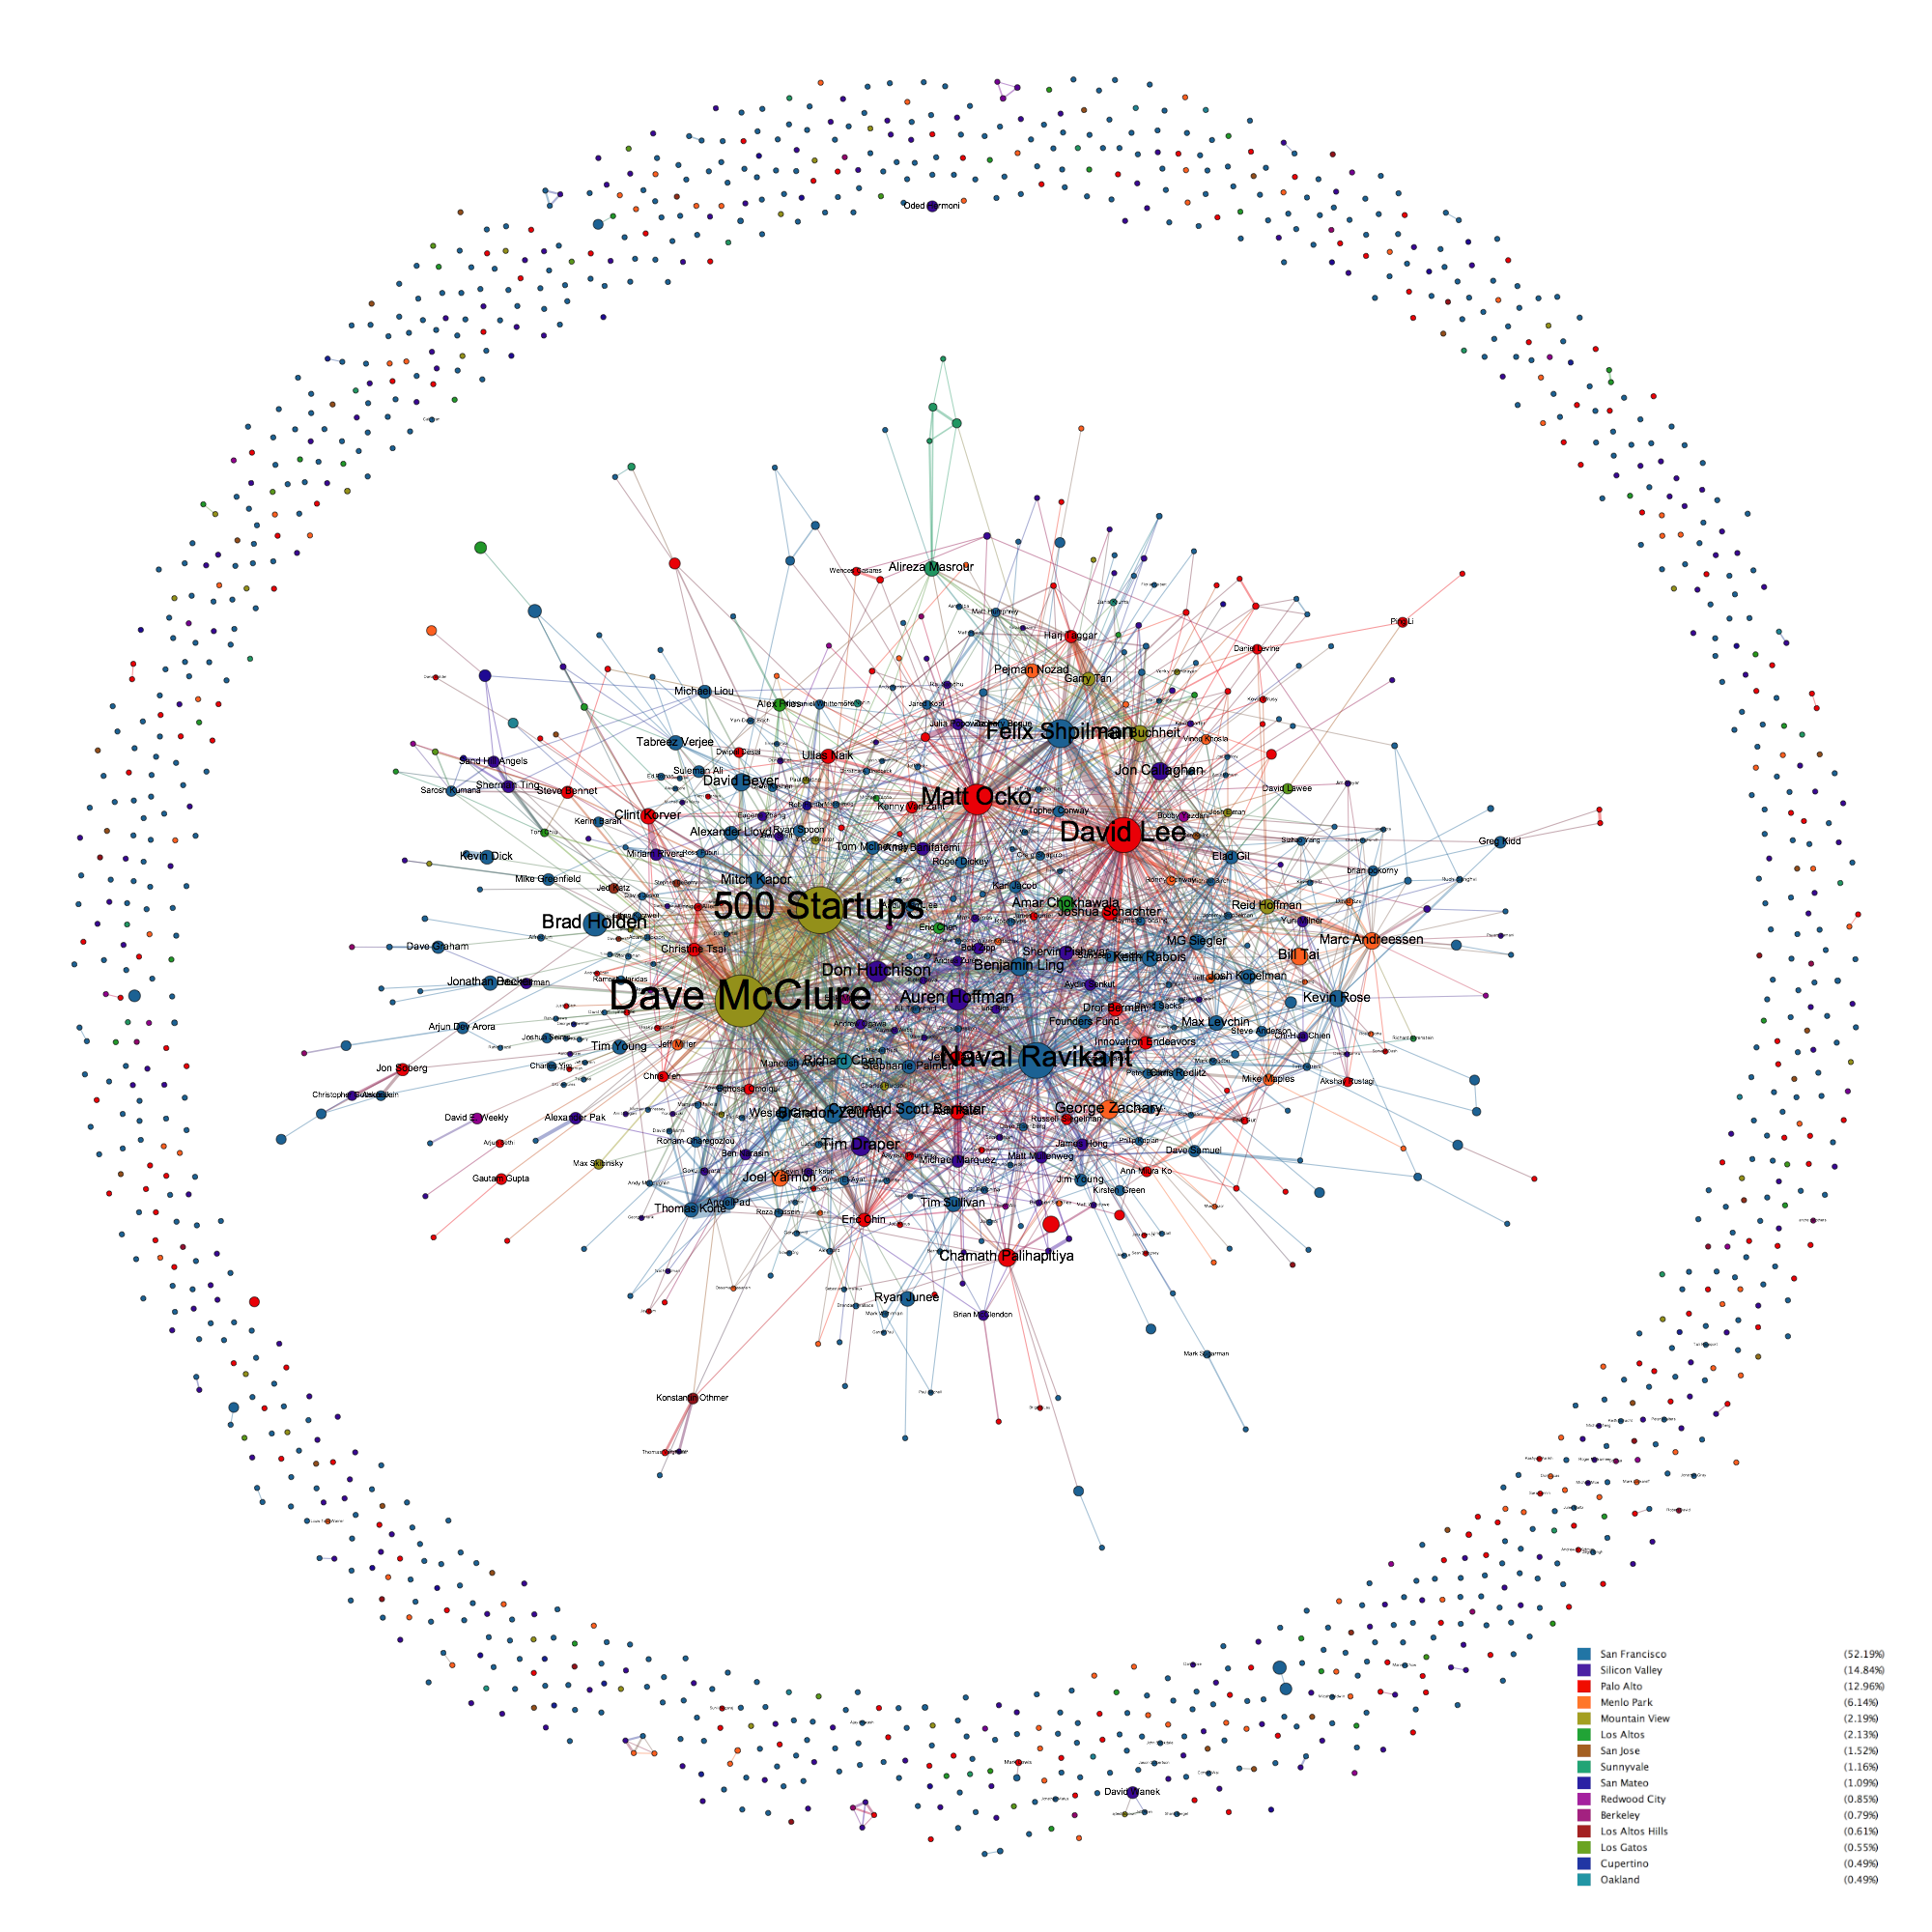
In order to understand the investment activity for private companies in US, I created an interactive map to visualize the number of investment activities(size) and whether the number of activities increased or decreased(color) using CrunchBase data. The number next to state code shows the funding round count for given year. All calculations are based on funding round count not the amount.

Large View

Here are some quick observations. If it is too hard to follow, please click “Large View” link above to open the map in a separate tap/window.

  • The data shows that there was a big jump of funding activities in 2005 compared to 2004 across US. In 2005, companies in California raised 416 rounds compared to 73 in 2004. That’s 469% increase in just one year. During same period, the number of investment rounds for companies in Massachusetts jumped from 18 to 93, a 416% increase. However, NVCA’s yearbook (Link) does not suggest that such jump existed so it may simply because TechCrunch started in 2005 (Link) so they do not have as much coverage before 2005.
  • In 2008, New York passes Massachusetts in terms of number of investment activities and it stays until 2013.
  • You will see the beginning of recession in 2008 but both California and New York raised more rounds than they did in 2007. In 2009, the recession continues and it is the only year in which California’s number decreases since 2002.
  • In 2011, both Illinois and Ohio companies doubles number of investment activities. For Illinois, it could be due to a state-wide effort to encourage startups such as the launch of Startup Illinois (link). Although I could not find a similar state-wide initiative, there were online articles mentioning school and community-wide activities (Link).
  • 2013 shows many east coast states getting higher traction compared to west coast states with North Carolina, Maryland, and Connecticut closing more than double the number from previous year. Although one year is just too short to confirm the trend, it will be interesting to see whether this behavior continues in 2014.
  • Please share your own observations in comment section.
  • Thanks to CrunchBase for awesome dataset and I love the new look. You should check it out. (Link)

Making Sense of AngelList #1 : Investors

Introduction

A screenshot of AngelList mainpage

A screenshot of AngelList mainpage

AngelList is probably the largest open network of start ups, founders, and investors. It also provides a nice API for others like myself to play with the data. I had some fun analyzing the dataset since January and wanted to put a bit more formality into sharing the result. So I will be organizing the methodologies and results as a series of posts instead of tweets.

Understanding investors has multiple benefits.

  1. One can see the trend in markets. It is important not only for identifying pain points but also pivoting on your existing business or ideas.
  2. Use it to target more relevant investors. Perhaps even a lead investor.
  3. And more…

Methodology

Investors

Investors are filtered from a full list of users who had a “startup role” of “past_investor”.

Primary Locations and Meta Location

  • Investors’ primary location was chosen as the first in the “locations” attribute.
  • Meta location was determined by manually merging primary locations.
  • There may be some inconsistencies or misrepresentation of some investors’ location.

Connections

Connections are drawn by finding the number of co-invested companies between two investors. For example, if “investor 1” and “investor 2” both invested in “company A” and “company B”, there will be a link drawn between them with weight “2.”

The Network

The network of investors with no threshold

Filtered by edge weight, sized by betweenness centrality score, colored by meta locations

Filtered by edge weight, sized by betweenness centrality score, colored by meta locations

Results

Centrality of investors versus followers and number of companies invested

Sized by betweenness centrality score, colored by number of companies invested

Sized by betweenness centrality score, colored by number of companies invested

Scatterplot of betweenness centrality score and number of companies invested

Scatterplot of betweenness centrality score and number of companies invested

Sized by betweenness centrality score, colored by number of followers

Sized by betweenness centrality score, colored by number of followers

Scatterplot of betweenness centrality score and number of followers

Scatterplot of betweenness centrality score and number of followers


Both number of followers and number of companies invested have some correlation with betweenness centrality score. One with number of companies invested is expected since the network was generated using the co-investments.

Giant cluster of Silicon Valley investors

Closer look at the central cluster of Silicon Valley investors

Closer look at the central cluster of Silicon Valley investors

I don’t know whether AngelList data is skewed toward Silicon Valley investors or many investors list SV as a primary location even if they don’t live there but SV investors take large majority and they are very central. They are well-connected to pretty much every group and co-mingled with the second largest group, NYC/Boston investors(teal color).

David McClure and 500 Startups because of their number of investments, have the highest betweenness centrality scores and pretty much all other centrality measures.

Investors in within Silicon Valley region

Investors in within Silicon Valley region

Within Silicon Valley, there is no distinct sub-groups based on smaller regions.

Silicon Valley investors acting as hubs

Brad Holden, a Silicon Valley investor is positioned to connect many Los Angeles based investors.

Brad Holden, a Silicon Valley investor is positioned to connect many Los Angeles based investors.

There are many examples of SV investors acting as hubs to other regional groups of investors. The most prominent one is Brad Holden(bottom right) who is connecting a very well-connected group of Los Angeles investors.

Joshua Baer is a Texas based investor who is connecting many investors in the same region.

Joshua Baer is a Texas based investor who is connecting many investors in the same region.

Another example is an investor who is based in a region outside of Silicon Valley but has made many investments with SV investors acting as a hub to regional investors. Joshua Baer(top center) and Bill Boebel are both are based in Texas but have many co-investment connections with SV investors are connecting other Texas based investors.

Ideas for Further Analysis

I wish I was able to get some temporal information to do more advanced analysis such as

  • A group of investors acting as flocks – How does certain attributes of investors inform/motivate other investors to act together?
  • How does information about startups disperse between investors?

Shout Out

  • Babak Nivi(@nivi) for suggestion of ideas.
  • Joshua Slayton(@joshuaxls) for answering questions and accommodating additional data requests.

LA, home for entertainment, what about UI design?

An Example of Bad UI
An example of Bad UI

It was summer 2004 when I moved to LA for college.
Since then I have been attending some meetups regarding application development(LAMP, RoR, etc), UX(User eXpereince), Funding events, pretty much anything to do with internet and business.

LA has been called home for many entertainment companies and some tech companies such as PriceGrabber, MySpace and Shopzilla.
There are more tech companies being founded in a rapid pace with help of events like Twiistup and Dealmaker Media.
But in my opinion, LA isn’t the best place for startup. The primary reason being not enough funding for tech startups.

Despite the fact that there isn’t enough funding for tech startups, I want to bring out one possible reason. Lack of good UX architect/designer.
I am a firm beliver of good UI/UX. Consumers are getting smarter (or spoiled?) by good UI everyday. For example, people are choosing iPhone apps by looking at UI. There are 1572991029 RSS feed application on Apple iTunes App Store and only handful good looking apps are making decent to great money.

Maybe I didn’t do my research, but the only decent sized UX consulting firm in LA is HUGE and I do not know any great UX architect for web application personally(If you happen to know one, please let me know).
I think this has some or greater impact on LA tech scene. LA needs great UI/UX designers/architects to support startups. Most startups can not afford UX consulting firm. We need more individuals! This will lead to better applications which leads to more adoptions from users.

Do you agree with my point? or not? I want to hear from you. Drop me a line.