Background
I am moving to Boston, MA in June.
Although there are many aspects of living in a new city I am looking forward to, job search isn’t one that I am excited about. Not so much because it is not fun to be the “new guy,” but so much for the time I have to invest to find “the company” to work at.
Sometimes, doing things the hard way pays off at the end. So I wanted to use the data to analyze and to understand what Boston’s startup scene is like with some hope to narrow down my search for interesting companies.
Disclaimer
- The data being used for the analysis was gathered on March 10th, 2014. So any analysis including 2014 Q1 information is NOT complete.
- The companies, funding, people data are from CrunchBase and AngelList. But they are not disambiguated so some double counting could be presented. My intention is to present patterns rather than to present the exact numbers to be quoted.
- Network graphs can be browsed by dragging(to pan) and scrolling(to zoom). You can also click on any node to highlight its neighbor nodes.
- Some companies in other industries such as health care may be under represented since those companies are less likely to appear in CrunchBase or AngelList.
Boston Startup Scene
Markets
Large View
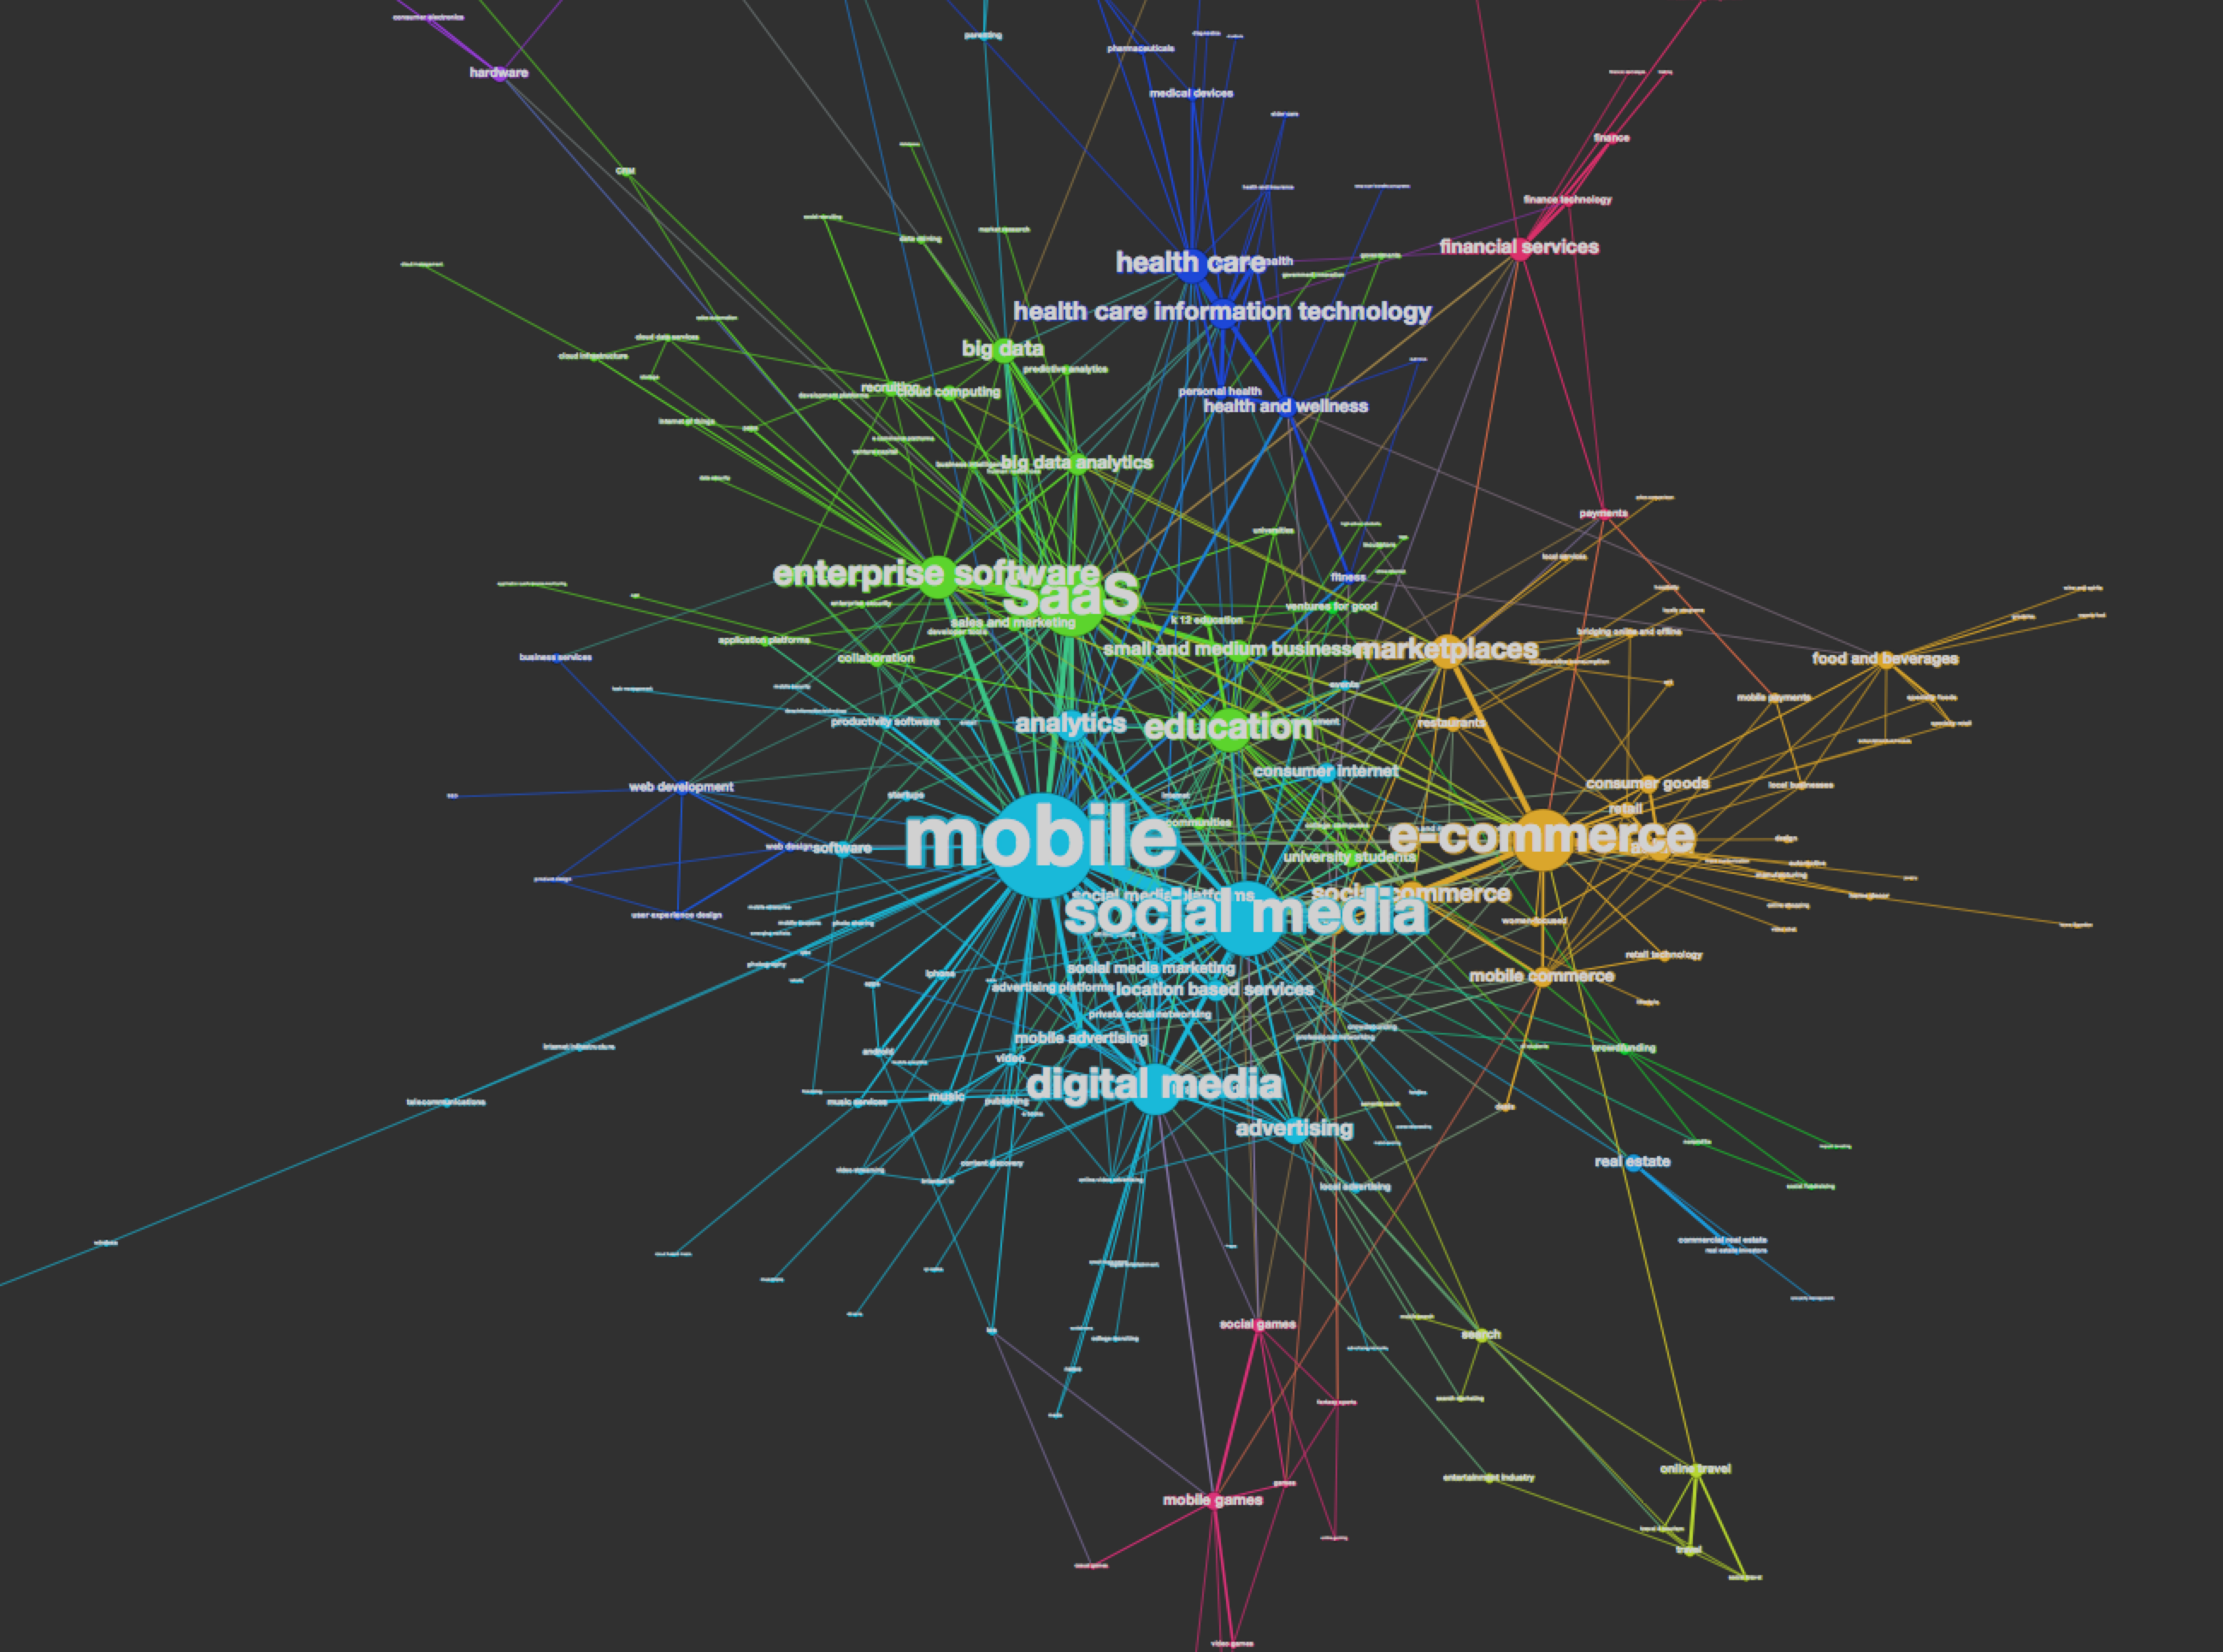
Market Relatedness Network (AngelList)
Nodes (250) : Market tags from AngelList
Edges (575) : Companies shared by two market tags
Color : Modularity, sub-networks/communities of markets
Size : # of Boston-based AngelList companies has the particular tag
Boston startups largely consist of mobile, social media, saas, and e-commerce markets with some distinct groups of gaming, healthcare, travel and robotics.
Many of these large markets are also present in market relatedness networks of other cities but distribution of hardware/robotics and healthcare markets are larger than other cities’. Given many academic and medical institutions in Boston area, this result makes a lot of sense.
Startups
Company Count by Founding Year
* AngelList doesn't have founding year attribute, so I used "created_at" to see the # of company profiles added.
The decrease in last two years are probably due to the fact that companies are added to CrunchBase based on major funding announcement. Looking at CrunchBase data, the number of companies founded in Boston is steadily increasing through 2012. AngelList data shows many startups are founded in Boston area but it may have to do with older companies being added to AngelList platform. Comparing with some other major cities such as San Francisco and New York, the decline in 2013 is not just for Boston-based companies. It will be interesting to see whether this downward trend continues throughout 2014.
Company Count by Top Tags(AngelList)
Company Count by Top Tags(CrunchBase)
As market relatedness network showed, mobile, social media, and saas are top tags on both charts. AngelList chart shows that education and health care companies are being founded and CrunchBase chart reveals analytics companies are also trending.
Large View
Company Relatedness Network (AngelList)
Nodes (745) : Boston-based companies from AngelList
Edges (2706) : Market tags shared by two companies
Color : Modularity, sub-networks/communities of companies
Size : Follower count for each company
People’s Skills vs Job Skills
Developer
Most skills for developers are around mobile and web development. The ratio of all skills between developers and development jobs range from 1:5 to 1:2 except for ios development and objective c which are in very high demand. If you are an ios developer, the data shows that you will have a better chance of finding a job. =)
Designer & PM
It is interesting to see that many development skills are being required for designers and some PM jobs.
Large View
People Skill Network (AngelList)
Nodes (200) : Top 200 people in Boston based on betweenness centrality score
Edges (5327) : Skill similarity between people
Color : Modularity
Size : Betweenness centrality score
This is more or less for fun. Even filtering people with more than 3 skills, there are over 2200 people in Boston. Since Sigma.js is not capable of showing a network of that size, I filtered the network by betweenness centrality score. Coloring by modularity, it reveals sub-networks of developers(pink), product managers(green) and everyone else(blue).
Investors
Large View
Co-investment Investor Network (CrunchBase)
Nodes (65) : Investors(both institutional and individual) invested Boston-based startup
Edges (135) : Companies co-invested (more than 2)
Color : Type of investor, either institutional or individual
Size : # of funding rounds participated in Boston-based companies
5 Most Active Investors in Boston on AngelList
Selected based on 2013 funding round count
5 Most Active Investors in Boston on CrunchBase
Selected based on 2013 funding round count
Keep in mind that some rounds of investment maybe double counted. This is more important to see the increasing pattern of amount. The spike in 2014 Q1 from CrunchBase data is due to a massive funding round($600M) of an energy company, Cape Wind.
Search for a Skill Fit
Large View
Company Relatedness Network (AngelList)
Nodes (209) : Boston-based companies
Edges (744) : Connected by number of employees with similar skills
Color : Relevancy. More relevant to me(Green), less but still relevant(Blue)
Size : Relevancy. Nodes directly connected to me is slightly larger
Here is an attempt to find a short list of companies based on employees who has similar skillset as me. I don’t know much about these companies but many of them seem to be in marketing and analytics. Even though I am not limiting my search solely based on these companies, it is a good starting point.
What’s Next?
- Does the downward trend continues in 2014? What is causing it?
- TF-IDF normalization on tags to compare with different cities’ data.
- Disambiguate companies, people, and other documents
- More cities.
- Add more data sources such as LinkedIn, GitHub, etc.
Credit
- W. Bryan Smith(LinkedIn and Twitter @questgen) for brainstorming ideas and feedback.
- Joshua Slayton(Twitter @joshuaxls) for AngelList data request
Recent Comments