US Investment Activity by State from 2001

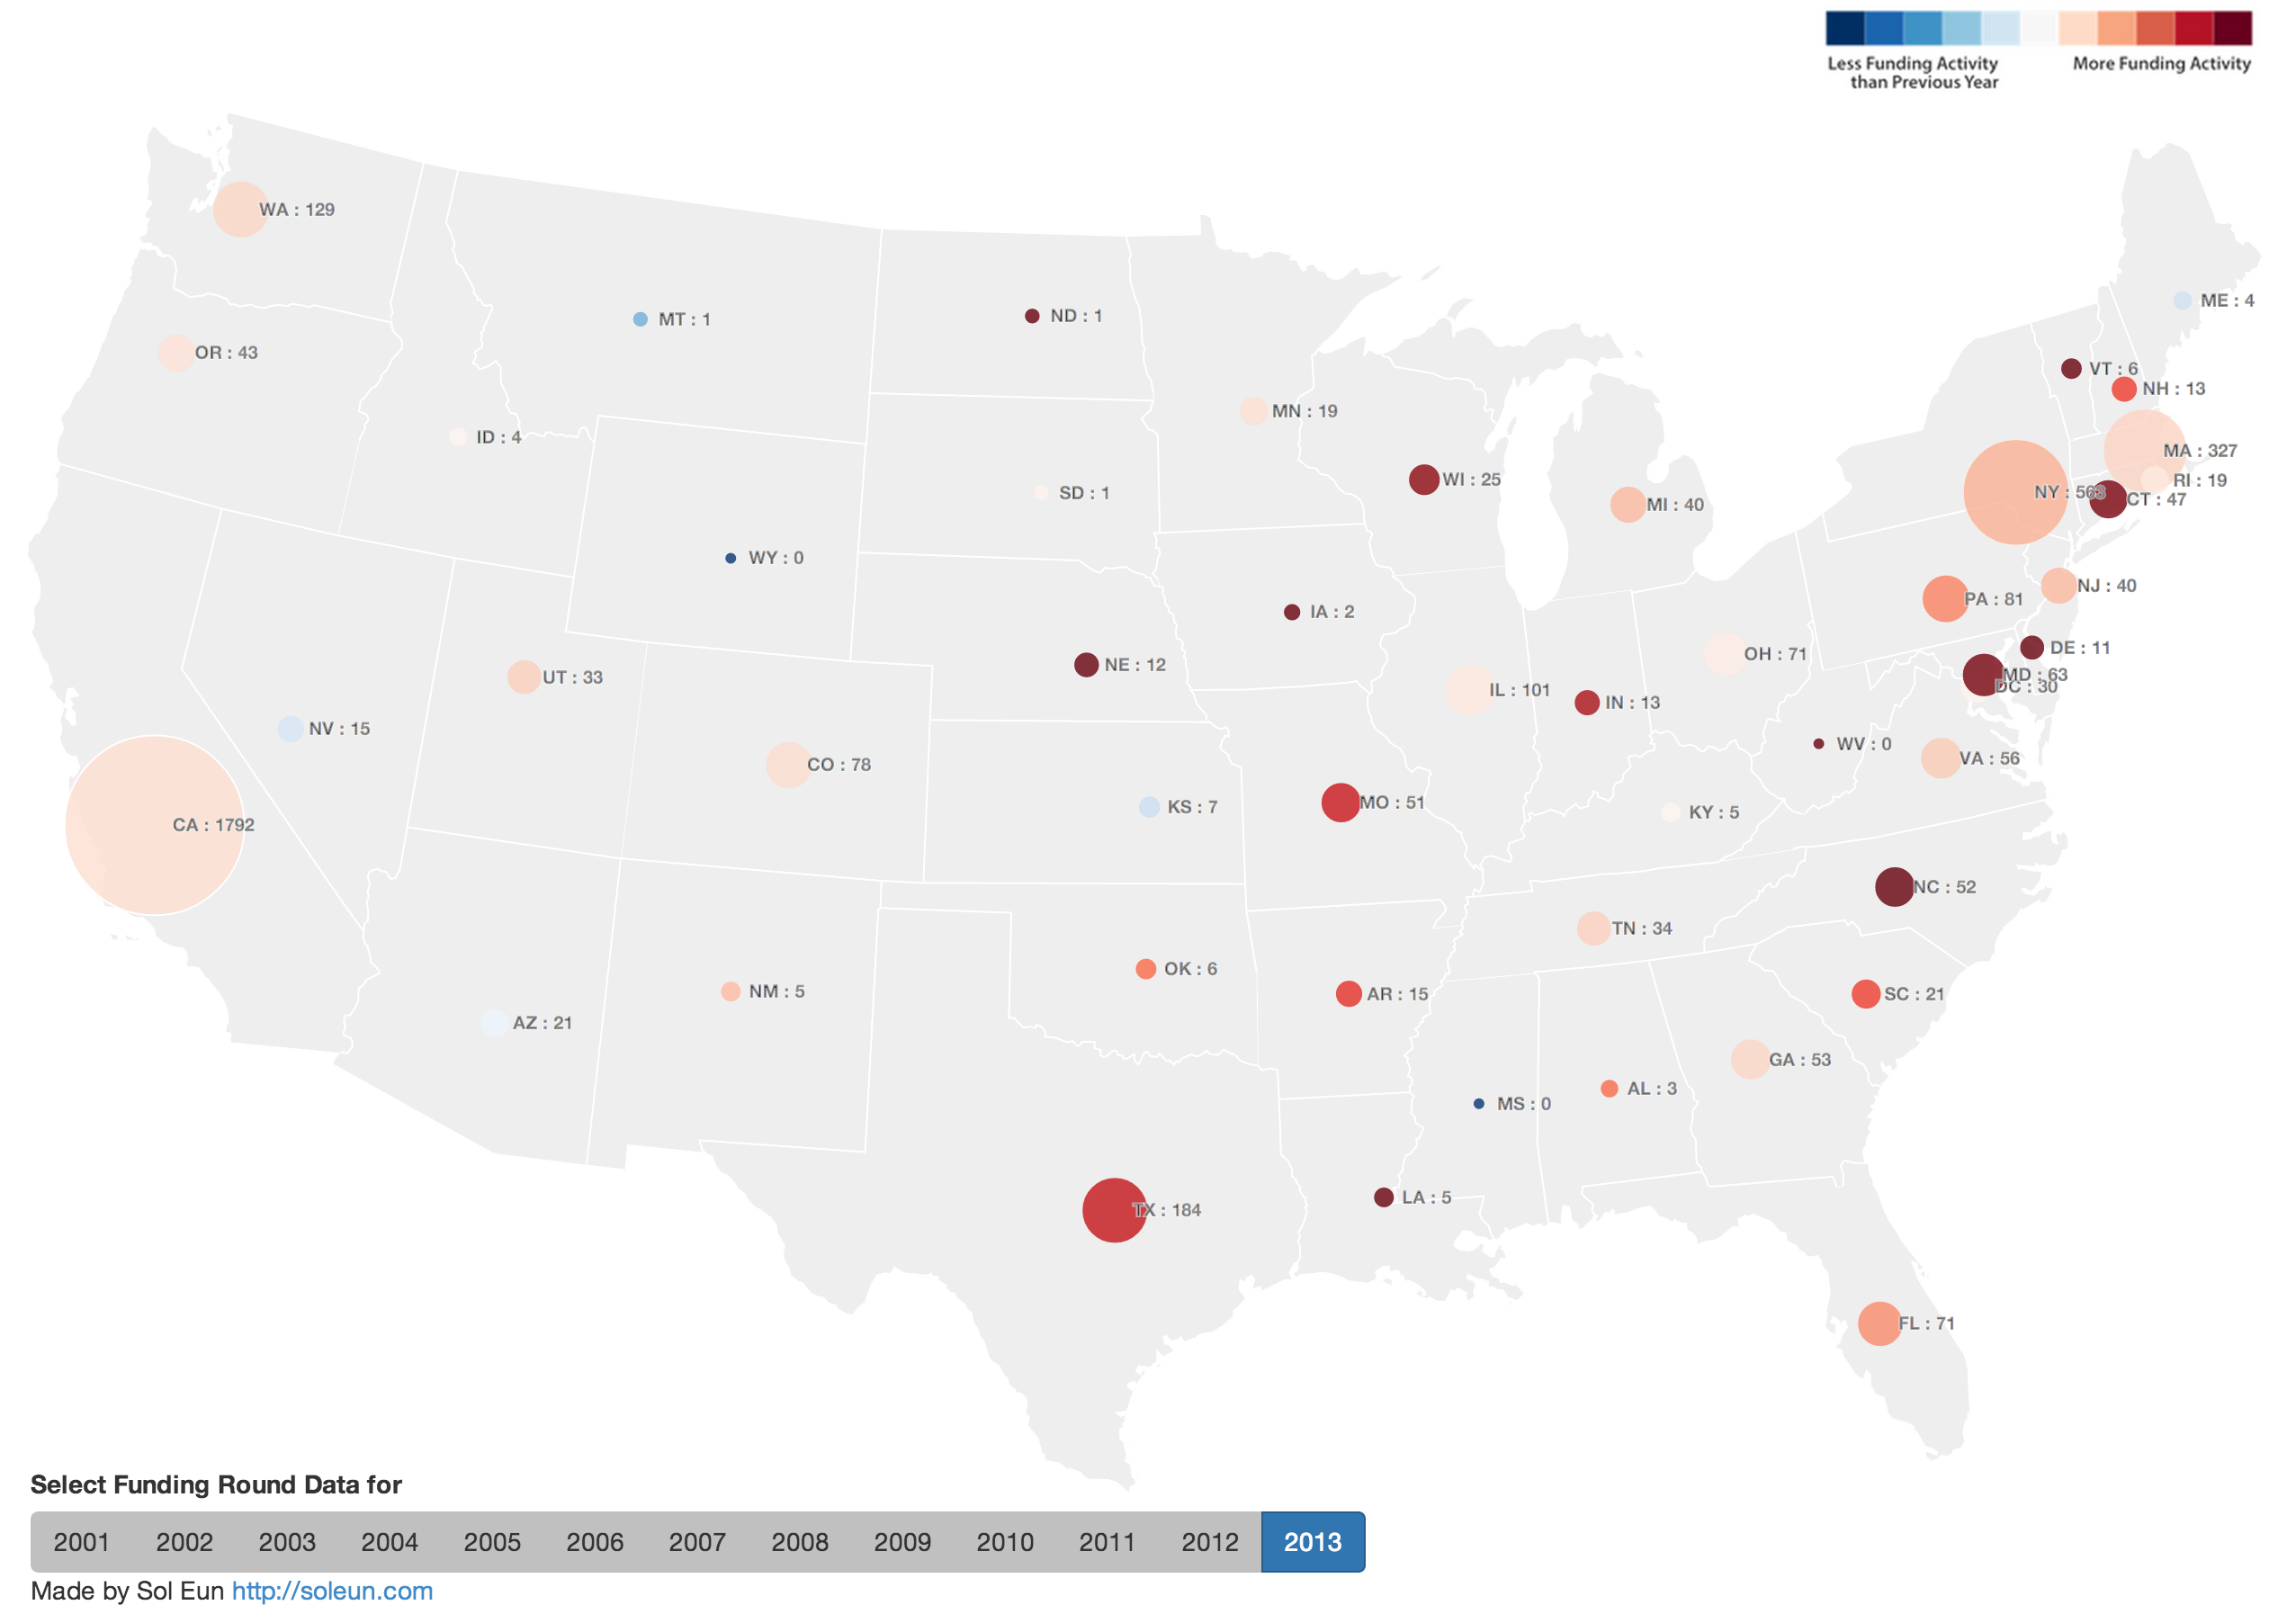
In order to understand the investment activity for private companies in US, I created an interactive map to visualize the number of investment activities(size) and whether the number of activities increased or decreased(color) using CrunchBase data. The number next to state code shows the funding round count for given year. All calculations are based on funding round count not the amount.

Large View

Here are some quick observations. If it is too hard to follow, please click “Large View” link above to open the map in a separate tap/window.

  • The data shows that there was a big jump of funding activities in 2005 compared to 2004 across US. In 2005, companies in California raised 416 rounds compared to 73 in 2004. That’s 469% increase in just one year. During same period, the number of investment rounds for companies in Massachusetts jumped from 18 to 93, a 416% increase. However, NVCA’s yearbook (Link) does not suggest that such jump existed so it may simply because TechCrunch started in 2005 (Link) so they do not have as much coverage before 2005.
  • In 2008, New York passes Massachusetts in terms of number of investment activities and it stays until 2013.
  • You will see the beginning of recession in 2008 but both California and New York raised more rounds than they did in 2007. In 2009, the recession continues and it is the only year in which California’s number decreases since 2002.
  • In 2011, both Illinois and Ohio companies doubles number of investment activities. For Illinois, it could be due to a state-wide effort to encourage startups such as the launch of Startup Illinois (link). Although I could not find a similar state-wide initiative, there were online articles mentioning school and community-wide activities (Link).
  • 2013 shows many east coast states getting higher traction compared to west coast states with North Carolina, Maryland, and Connecticut closing more than double the number from previous year. Although one year is just too short to confirm the trend, it will be interesting to see whether this behavior continues in 2014.
  • Please share your own observations in comment section.
  • Thanks to CrunchBase for awesome dataset and I love the new look. You should check it out. (Link)

Boston Startup Scene and Job Search Using Open Data

Background

I am moving to Boston, MA in June.

Although there are many aspects of living in a new city I am looking forward to, job search isn’t one that I am excited about. Not so much because it is not fun to be the “new guy,” but so much for the time I have to invest to find “the company” to work at.

Sometimes, doing things the hard way pays off at the end. So I wanted to use the data to analyze and to understand what Boston’s startup scene is like with some hope to narrow down my search for interesting companies.

Disclaimer

  • The data being used for the analysis was gathered on March 10th, 2014. So any analysis including 2014 Q1 information is NOT complete.
  • The companies, funding, people data are from CrunchBase and AngelList. But they are not disambiguated so some double counting could be presented. My intention is to present patterns rather than to present the exact numbers to be quoted.
  • Network graphs can be browsed by dragging(to pan) and scrolling(to zoom). You can also click on any node to highlight its neighbor nodes.
  • Some companies in other industries such as health care may be under represented since those companies are less likely to appear in CrunchBase or AngelList.

Boston Startup Scene

Markets


Large View

Market Relatedness Network (AngelList)
Nodes (250) : Market tags from AngelList
Edges (575) : Companies shared by two market tags
Color : Modularity, sub-networks/communities of markets
Size : # of Boston-based AngelList companies has the particular tag

Boston startups largely consist of mobile, social media, saas, and e-commerce markets with some distinct groups of gaming, healthcare, travel and robotics.
Many of these large markets are also present in market relatedness networks of other cities but distribution of hardware/robotics and healthcare markets are larger than other cities’. Given many academic and medical institutions in Boston area, this result makes a lot of sense.

Startups

Company Count by Founding Year
* AngelList doesn't have founding year attribute, so I used "created_at" to see the # of company profiles added.

The decrease in last two years are probably due to the fact that companies are added to CrunchBase based on major funding announcement. Looking at CrunchBase data, the number of companies founded in Boston is steadily increasing through 2012. AngelList data shows many startups are founded in Boston area but it may have to do with older companies being added to AngelList platform. Comparing with some other major cities such as San Francisco and New York, the decline in 2013 is not just for Boston-based companies. It will be interesting to see whether this downward trend continues throughout 2014.

Company Count by Top Tags(AngelList)
Company Count by Top Tags(CrunchBase)

As market relatedness network showed, mobile, social media, and saas are top tags on both charts. AngelList chart shows that education and health care companies are being founded and CrunchBase chart reveals analytics companies are also trending.


Large View

Company Relatedness Network (AngelList)
Nodes (745) : Boston-based companies from AngelList
Edges (2706) : Market tags shared by two companies
Color : Modularity, sub-networks/communities of companies
Size : Follower count for each company

People’s Skills vs Job Skills

Developer

Most skills for developers are around mobile and web development. The ratio of all skills between developers and development jobs range from 1:5 to 1:2 except for ios development and objective c which are in very high demand. If you are an ios developer, the data shows that you will have a better chance of finding a job. =)

Designer & PM

It is interesting to see that many development skills are being required for designers and some PM jobs.


Large View

People Skill Network (AngelList)
Nodes (200) : Top 200 people in Boston based on betweenness centrality score
Edges (5327) : Skill similarity between people
Color : Modularity
Size : Betweenness centrality score

This is more or less for fun. Even filtering people with more than 3 skills, there are over 2200 people in Boston. Since Sigma.js is not capable of showing a network of that size, I filtered the network by betweenness centrality score. Coloring by modularity, it reveals sub-networks of developers(pink), product managers(green) and everyone else(blue).

Investors


Large View

Co-investment Investor Network (CrunchBase)
Nodes (65) : Investors(both institutional and individual) invested Boston-based startup
Edges (135) : Companies co-invested (more than 2)
Color : Type of investor, either institutional or individual
Size : # of funding rounds participated in Boston-based companies

5 Most Active Investors in Boston on AngelList

Selected based on 2013 funding round count

5 Most Active Investors in Boston on CrunchBase

Selected based on 2013 funding round count


Keep in mind that some rounds of investment maybe double counted. This is more important to see the increasing pattern of amount. The spike in 2014 Q1 from CrunchBase data is due to a massive funding round($600M) of an energy company, Cape Wind.

Search for a Skill Fit


Large View

Company Relatedness Network (AngelList)
Nodes (209) : Boston-based companies
Edges (744) : Connected by number of employees with similar skills
Color : Relevancy. More relevant to me(Green), less but still relevant(Blue)
Size : Relevancy. Nodes directly connected to me is slightly larger

Here is an attempt to find a short list of companies based on employees who has similar skillset as me. I don’t know much about these companies but many of them seem to be in marketing and analytics. Even though I am not limiting my search solely based on these companies, it is a good starting point.

What’s Next?

  • Does the downward trend continues in 2014? What is causing it?
  • TF-IDF normalization on tags to compare with different cities’ data.
  • Disambiguate companies, people, and other documents
  • More cities.
  • Add more data sources such as LinkedIn, GitHub, etc.

Credit

  • W. Bryan Smith(LinkedIn and Twitter @questgen) for brainstorming ideas and feedback.
  • Joshua Slayton(Twitter @joshuaxls) for AngelList data request
Visualizing 350 million people movement in US

A screenshot from 48 states animation (during the time of hurricane Katrina)

I worked on visualizing US address change records for last two months and my work has been published in company’s blog.
I originally started with getting high level pictures from Gephi but realized that Gephi wasn’t quite suited for visualizing what I wanted to convey. So I wrote a program in Java using processing library to gain finer control over some visual primitives for coloring, sizing and animation.

So head over and take a look at the post by clicking the link below.

http://www.spokeo.com/blog/visualizing-us-address-change-records-in-2000-2009

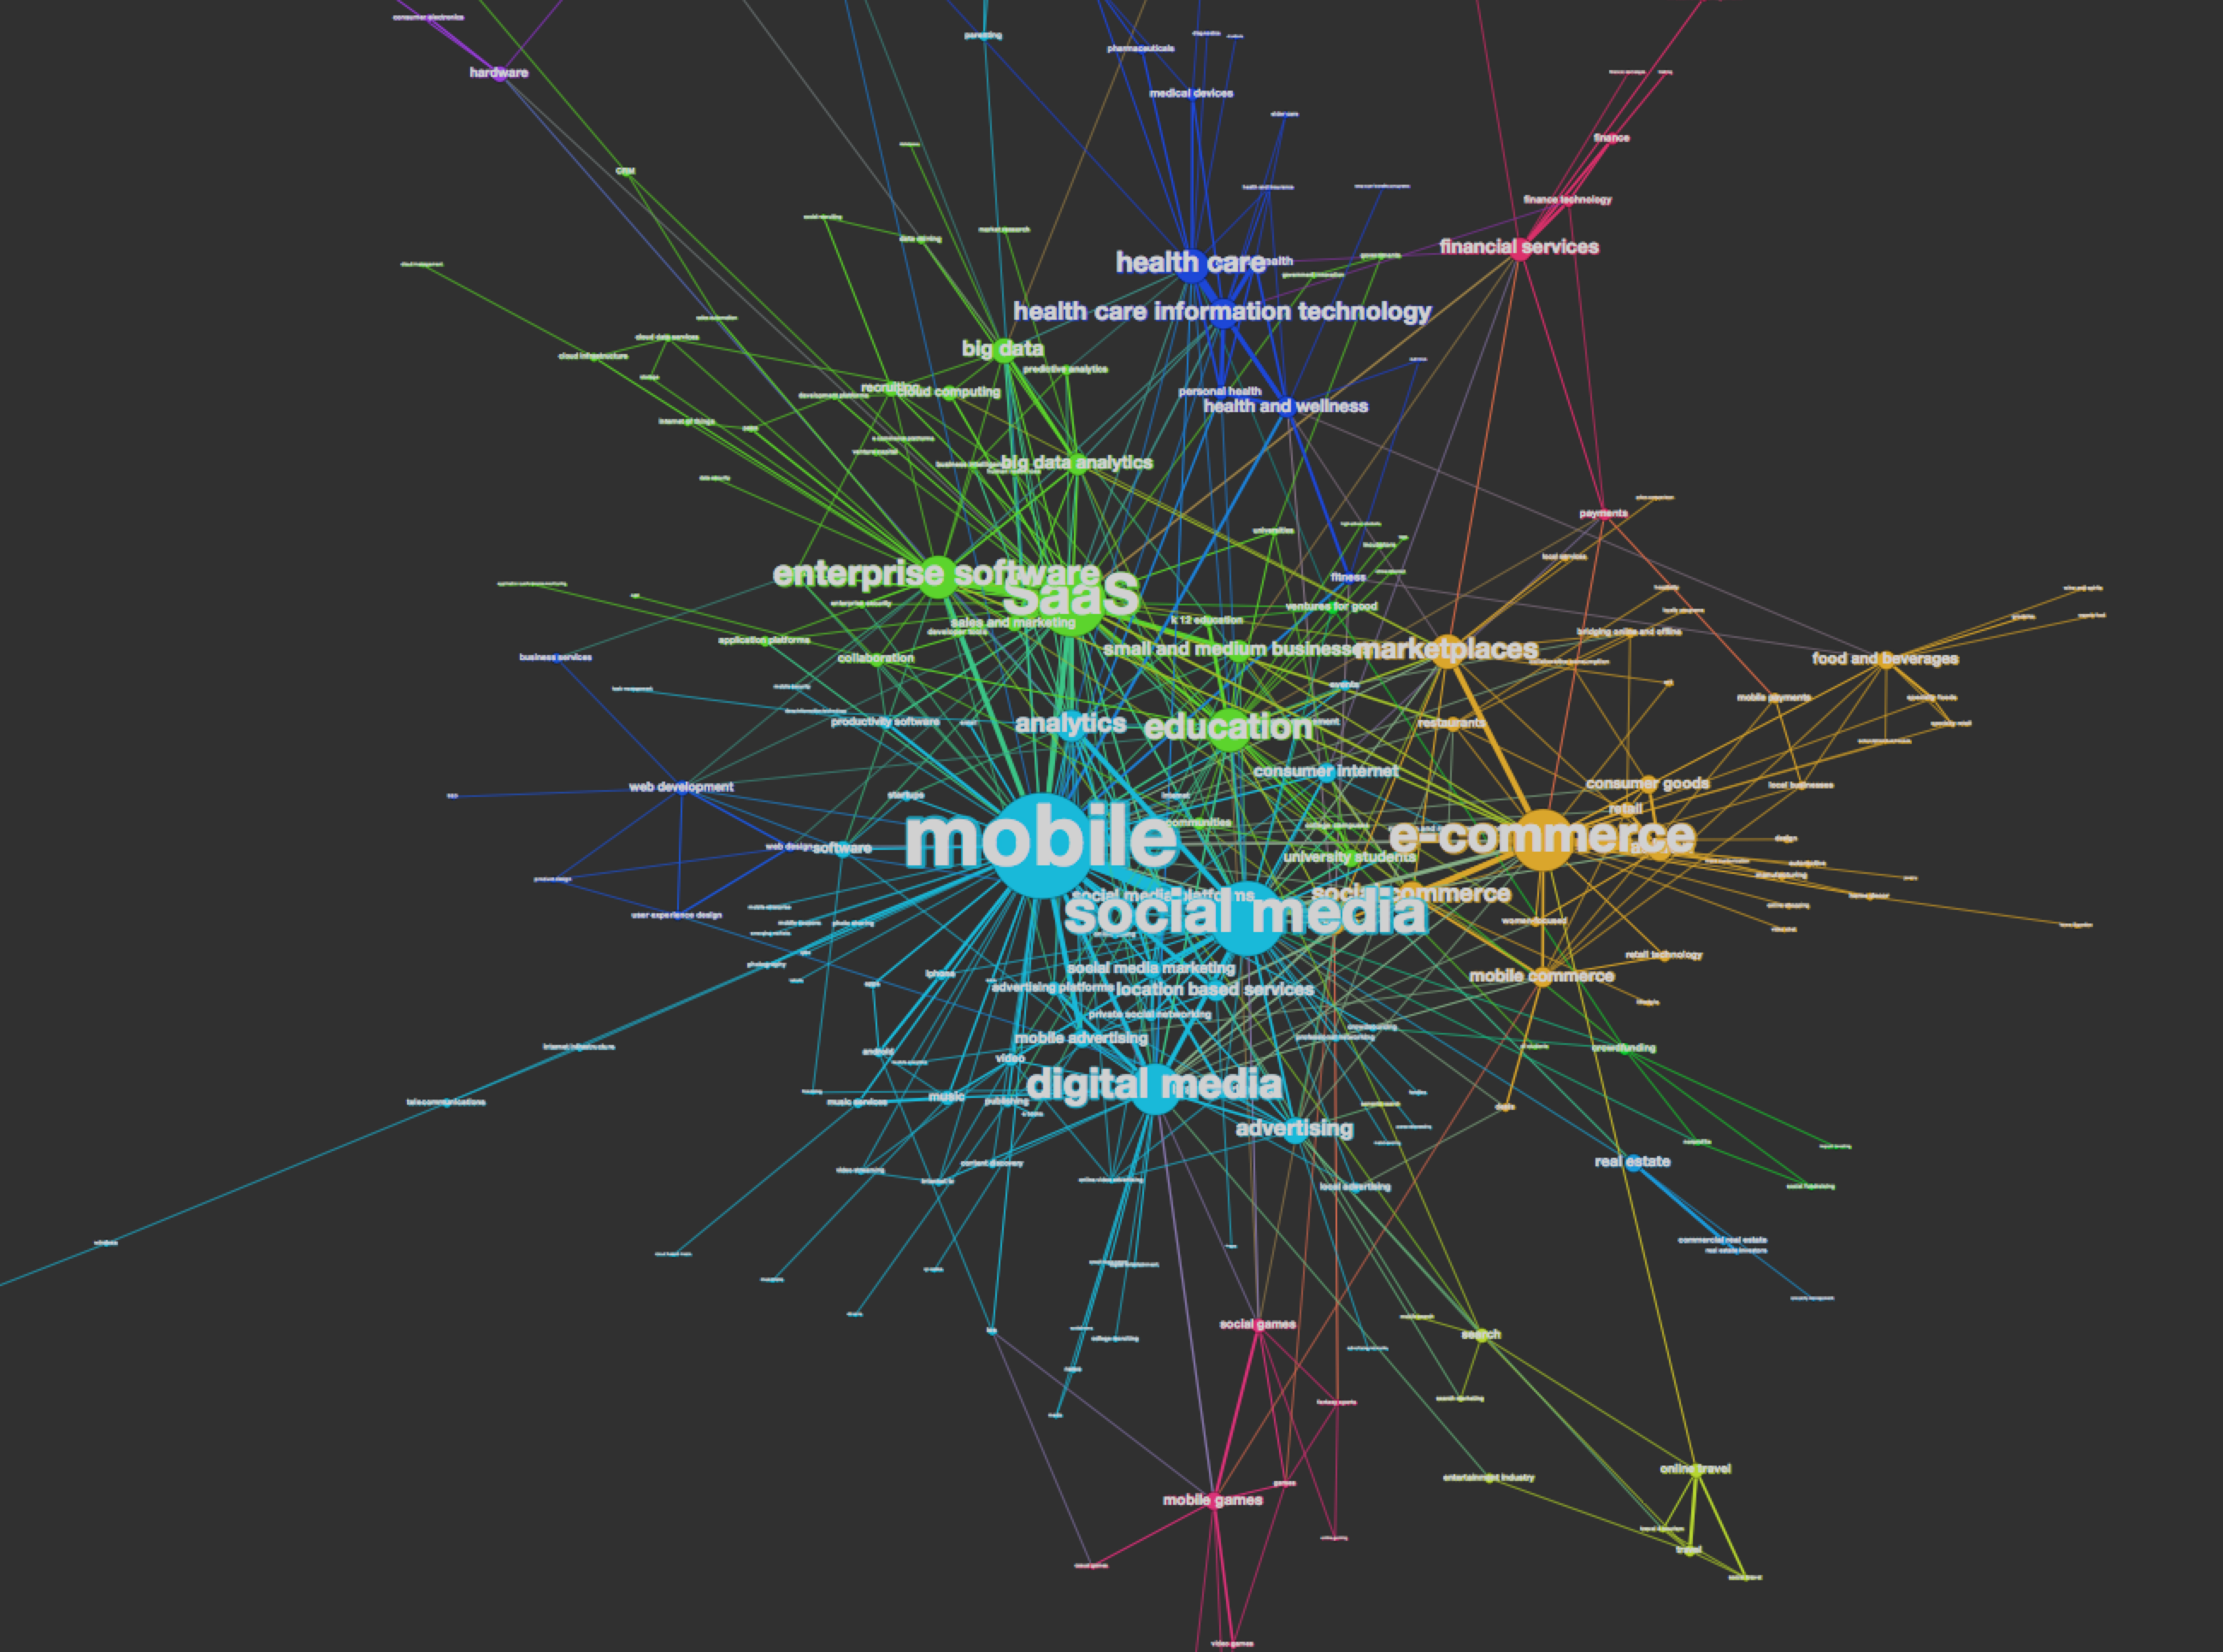
Making Sense of AngelList #1 : Investors

Introduction

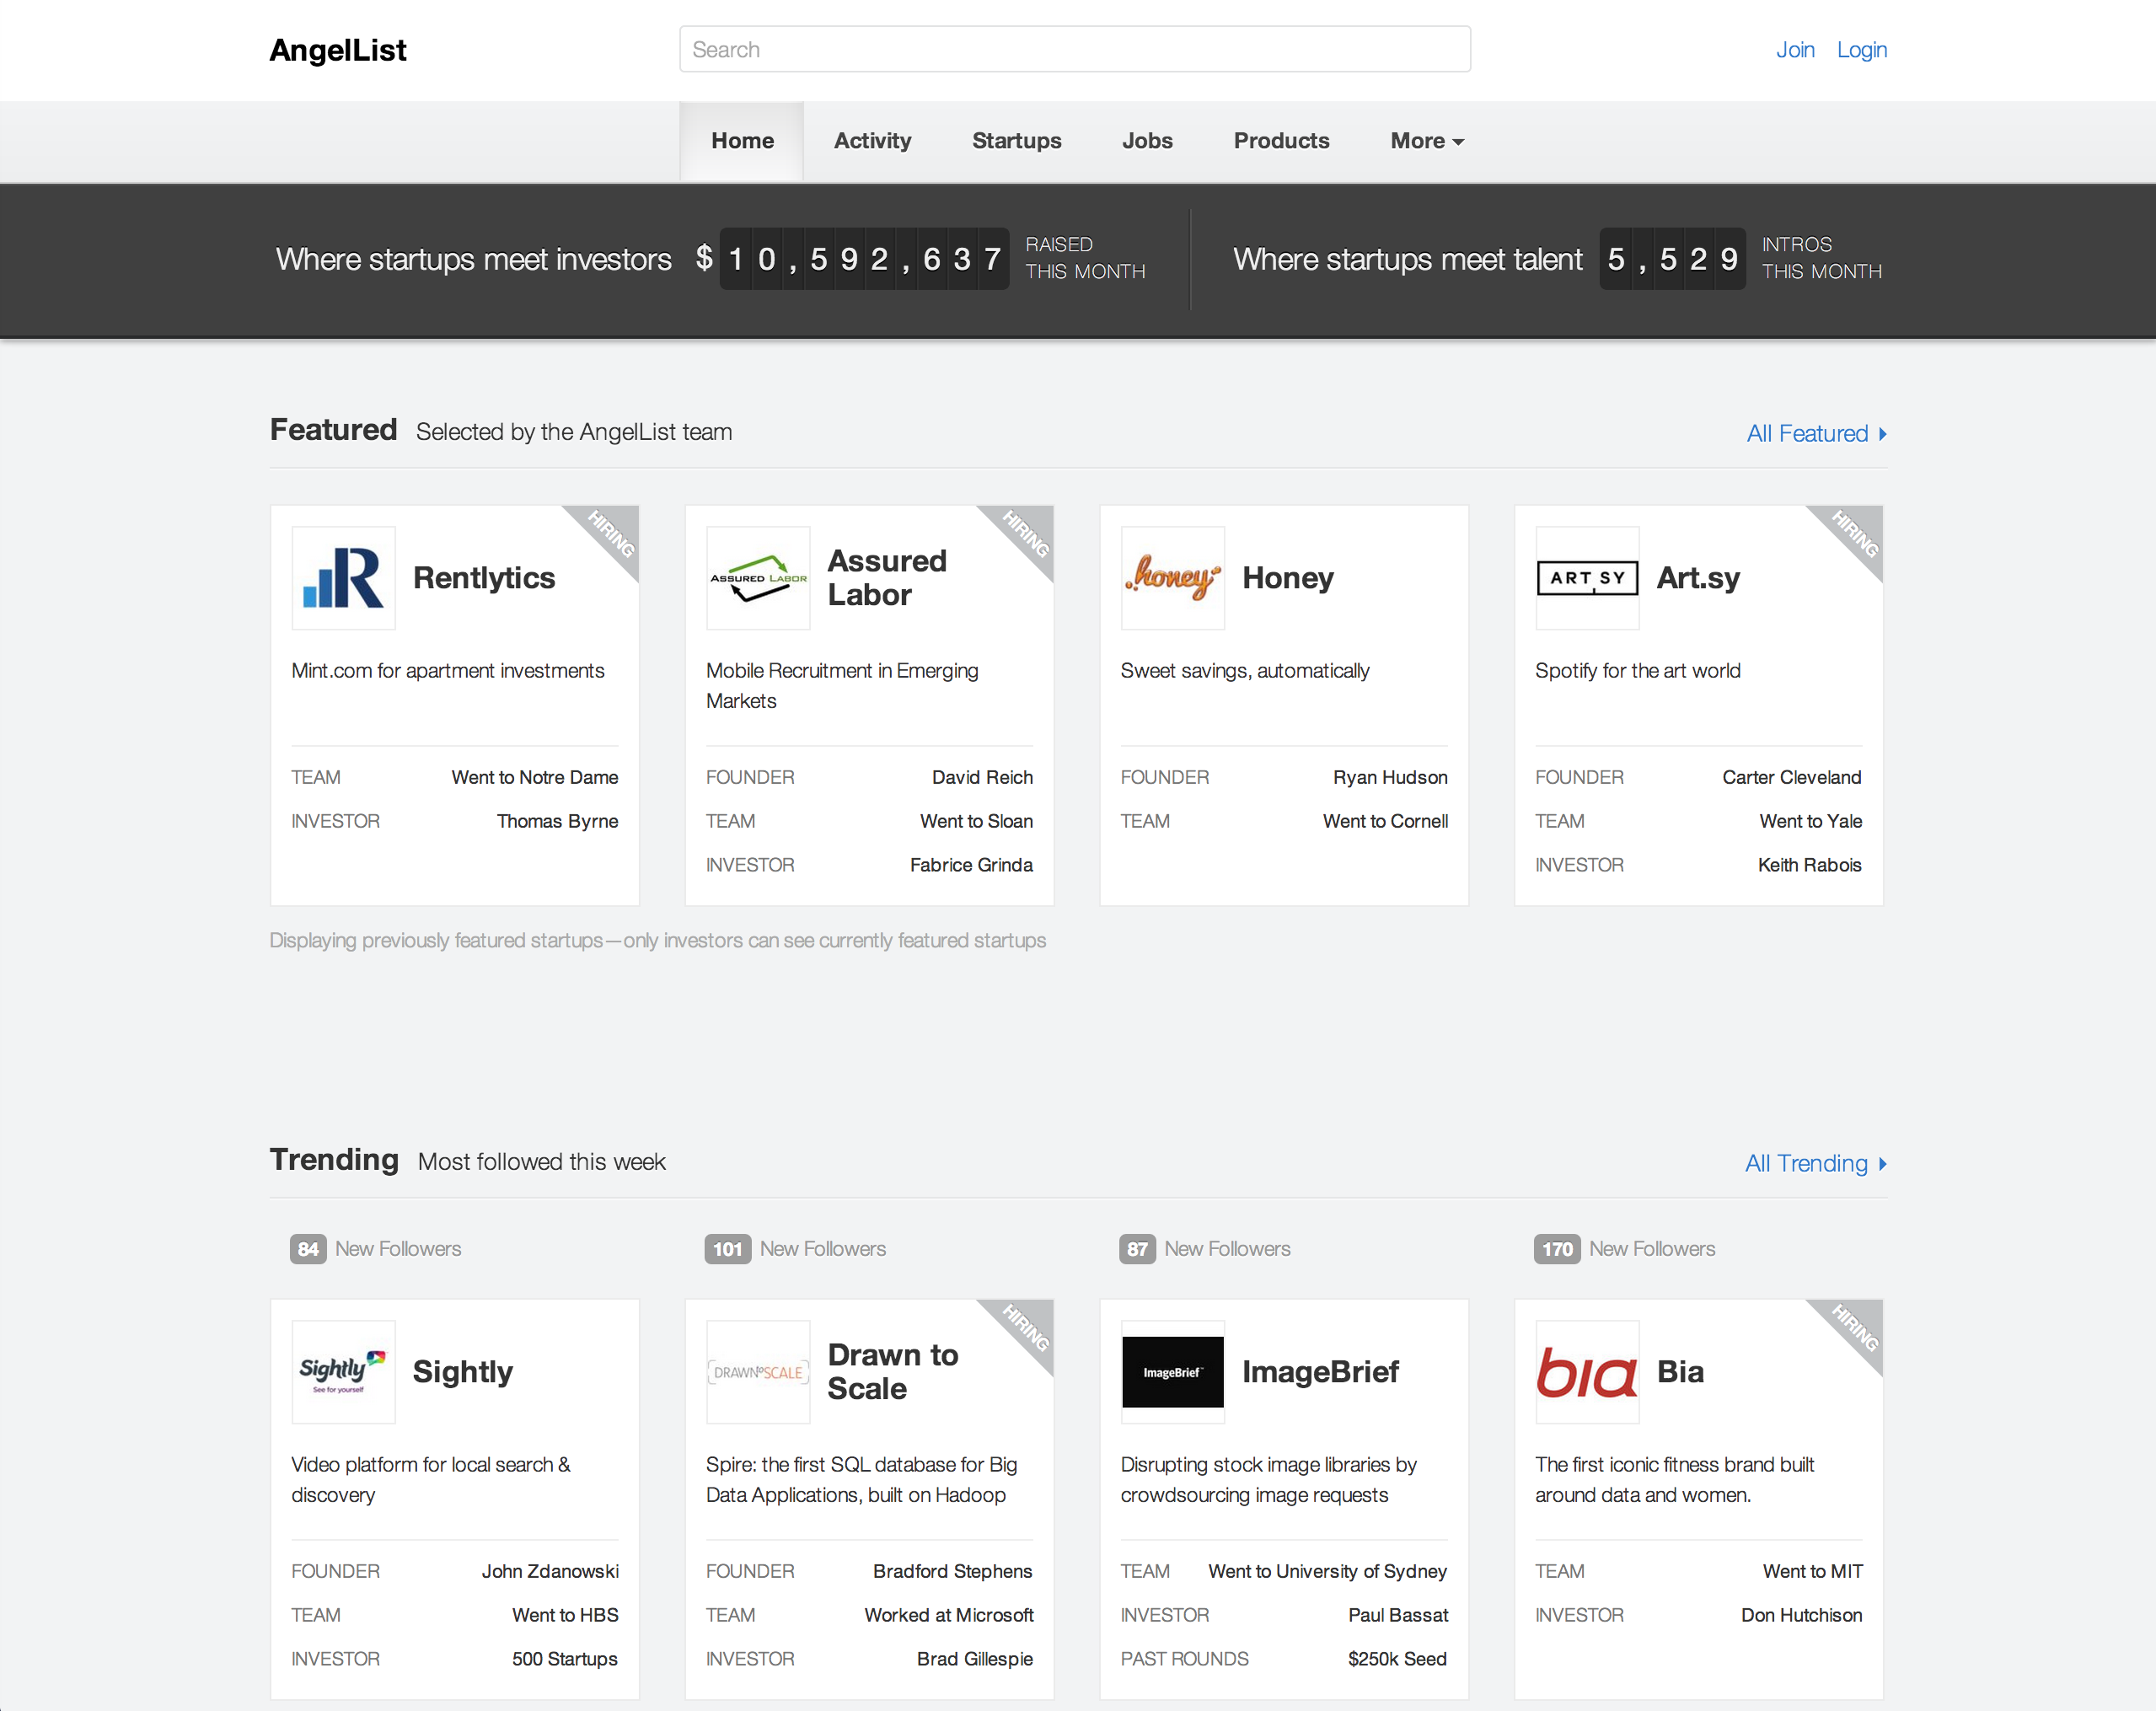
A screenshot of AngelList mainpage

A screenshot of AngelList mainpage

AngelList is probably the largest open network of start ups, founders, and investors. It also provides a nice API for others like myself to play with the data. I had some fun analyzing the dataset since January and wanted to put a bit more formality into sharing the result. So I will be organizing the methodologies and results as a series of posts instead of tweets.

Understanding investors has multiple benefits.

  1. One can see the trend in markets. It is important not only for identifying pain points but also pivoting on your existing business or ideas.
  2. Use it to target more relevant investors. Perhaps even a lead investor.
  3. And more…

Methodology

Investors

Investors are filtered from a full list of users who had a “startup role” of “past_investor”.

Primary Locations and Meta Location

  • Investors’ primary location was chosen as the first in the “locations” attribute.
  • Meta location was determined by manually merging primary locations.
  • There may be some inconsistencies or misrepresentation of some investors’ location.

Connections

Connections are drawn by finding the number of co-invested companies between two investors. For example, if “investor 1” and “investor 2” both invested in “company A” and “company B”, there will be a link drawn between them with weight “2.”

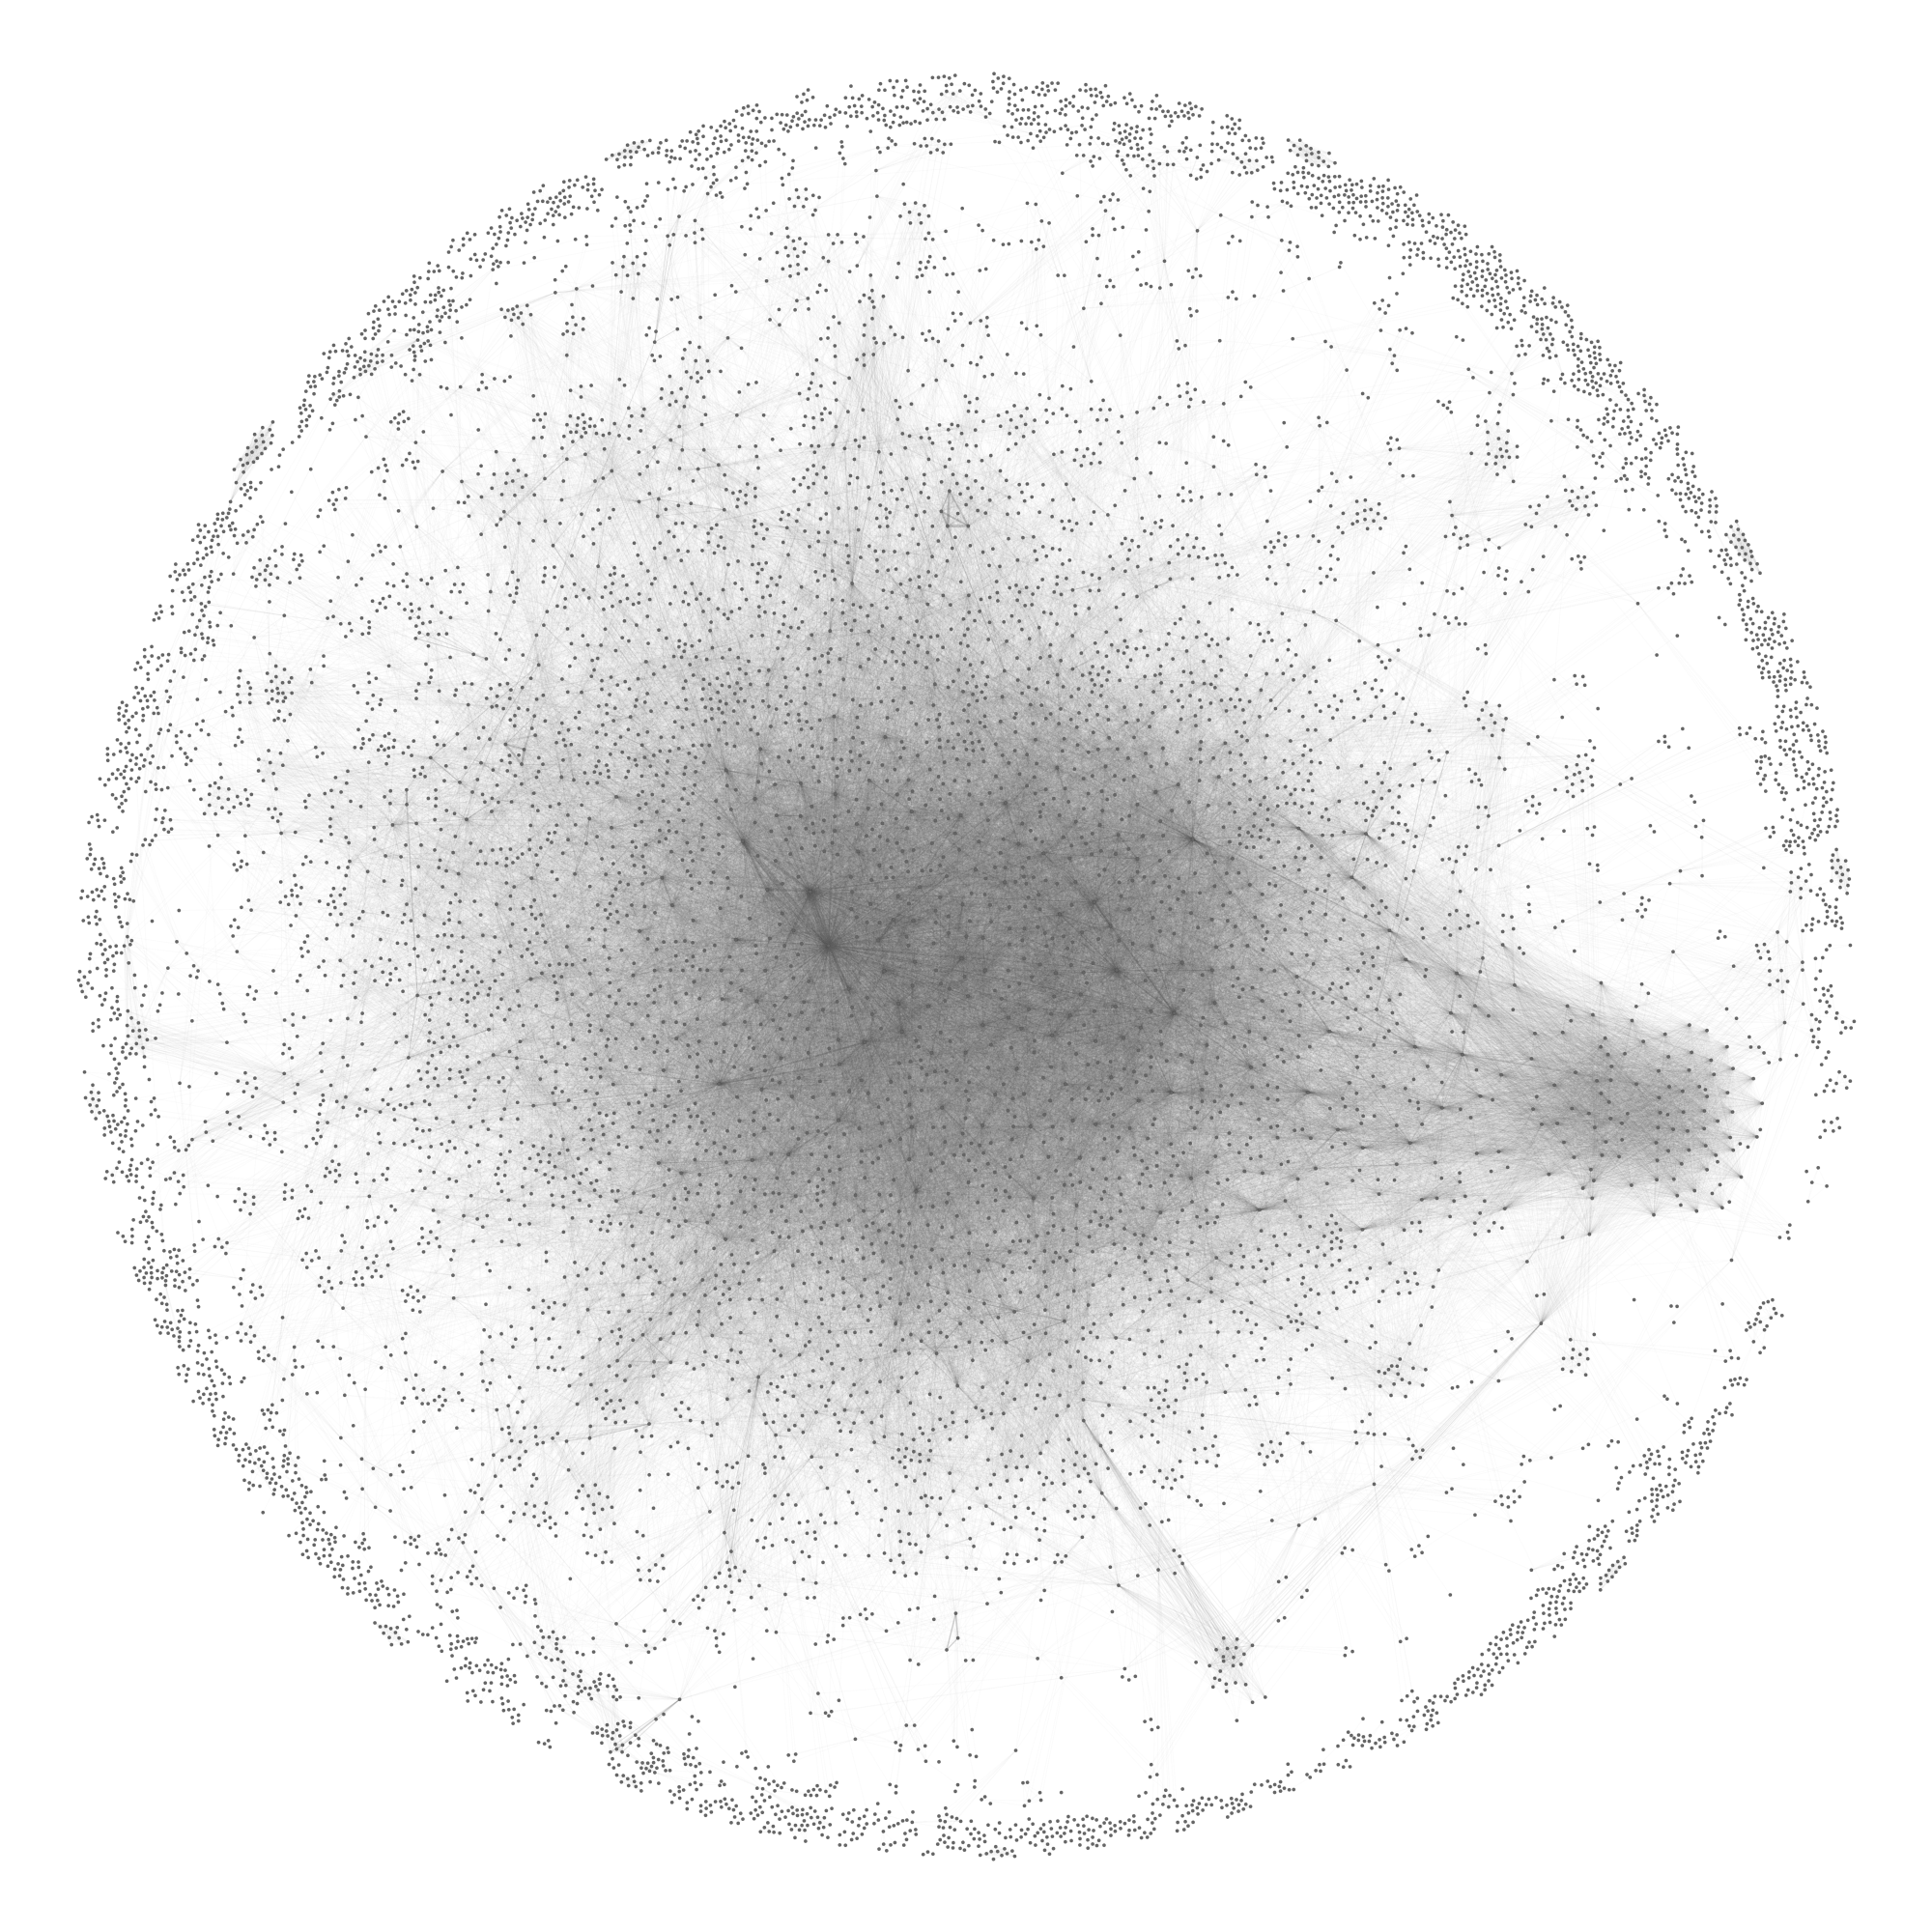
The Network

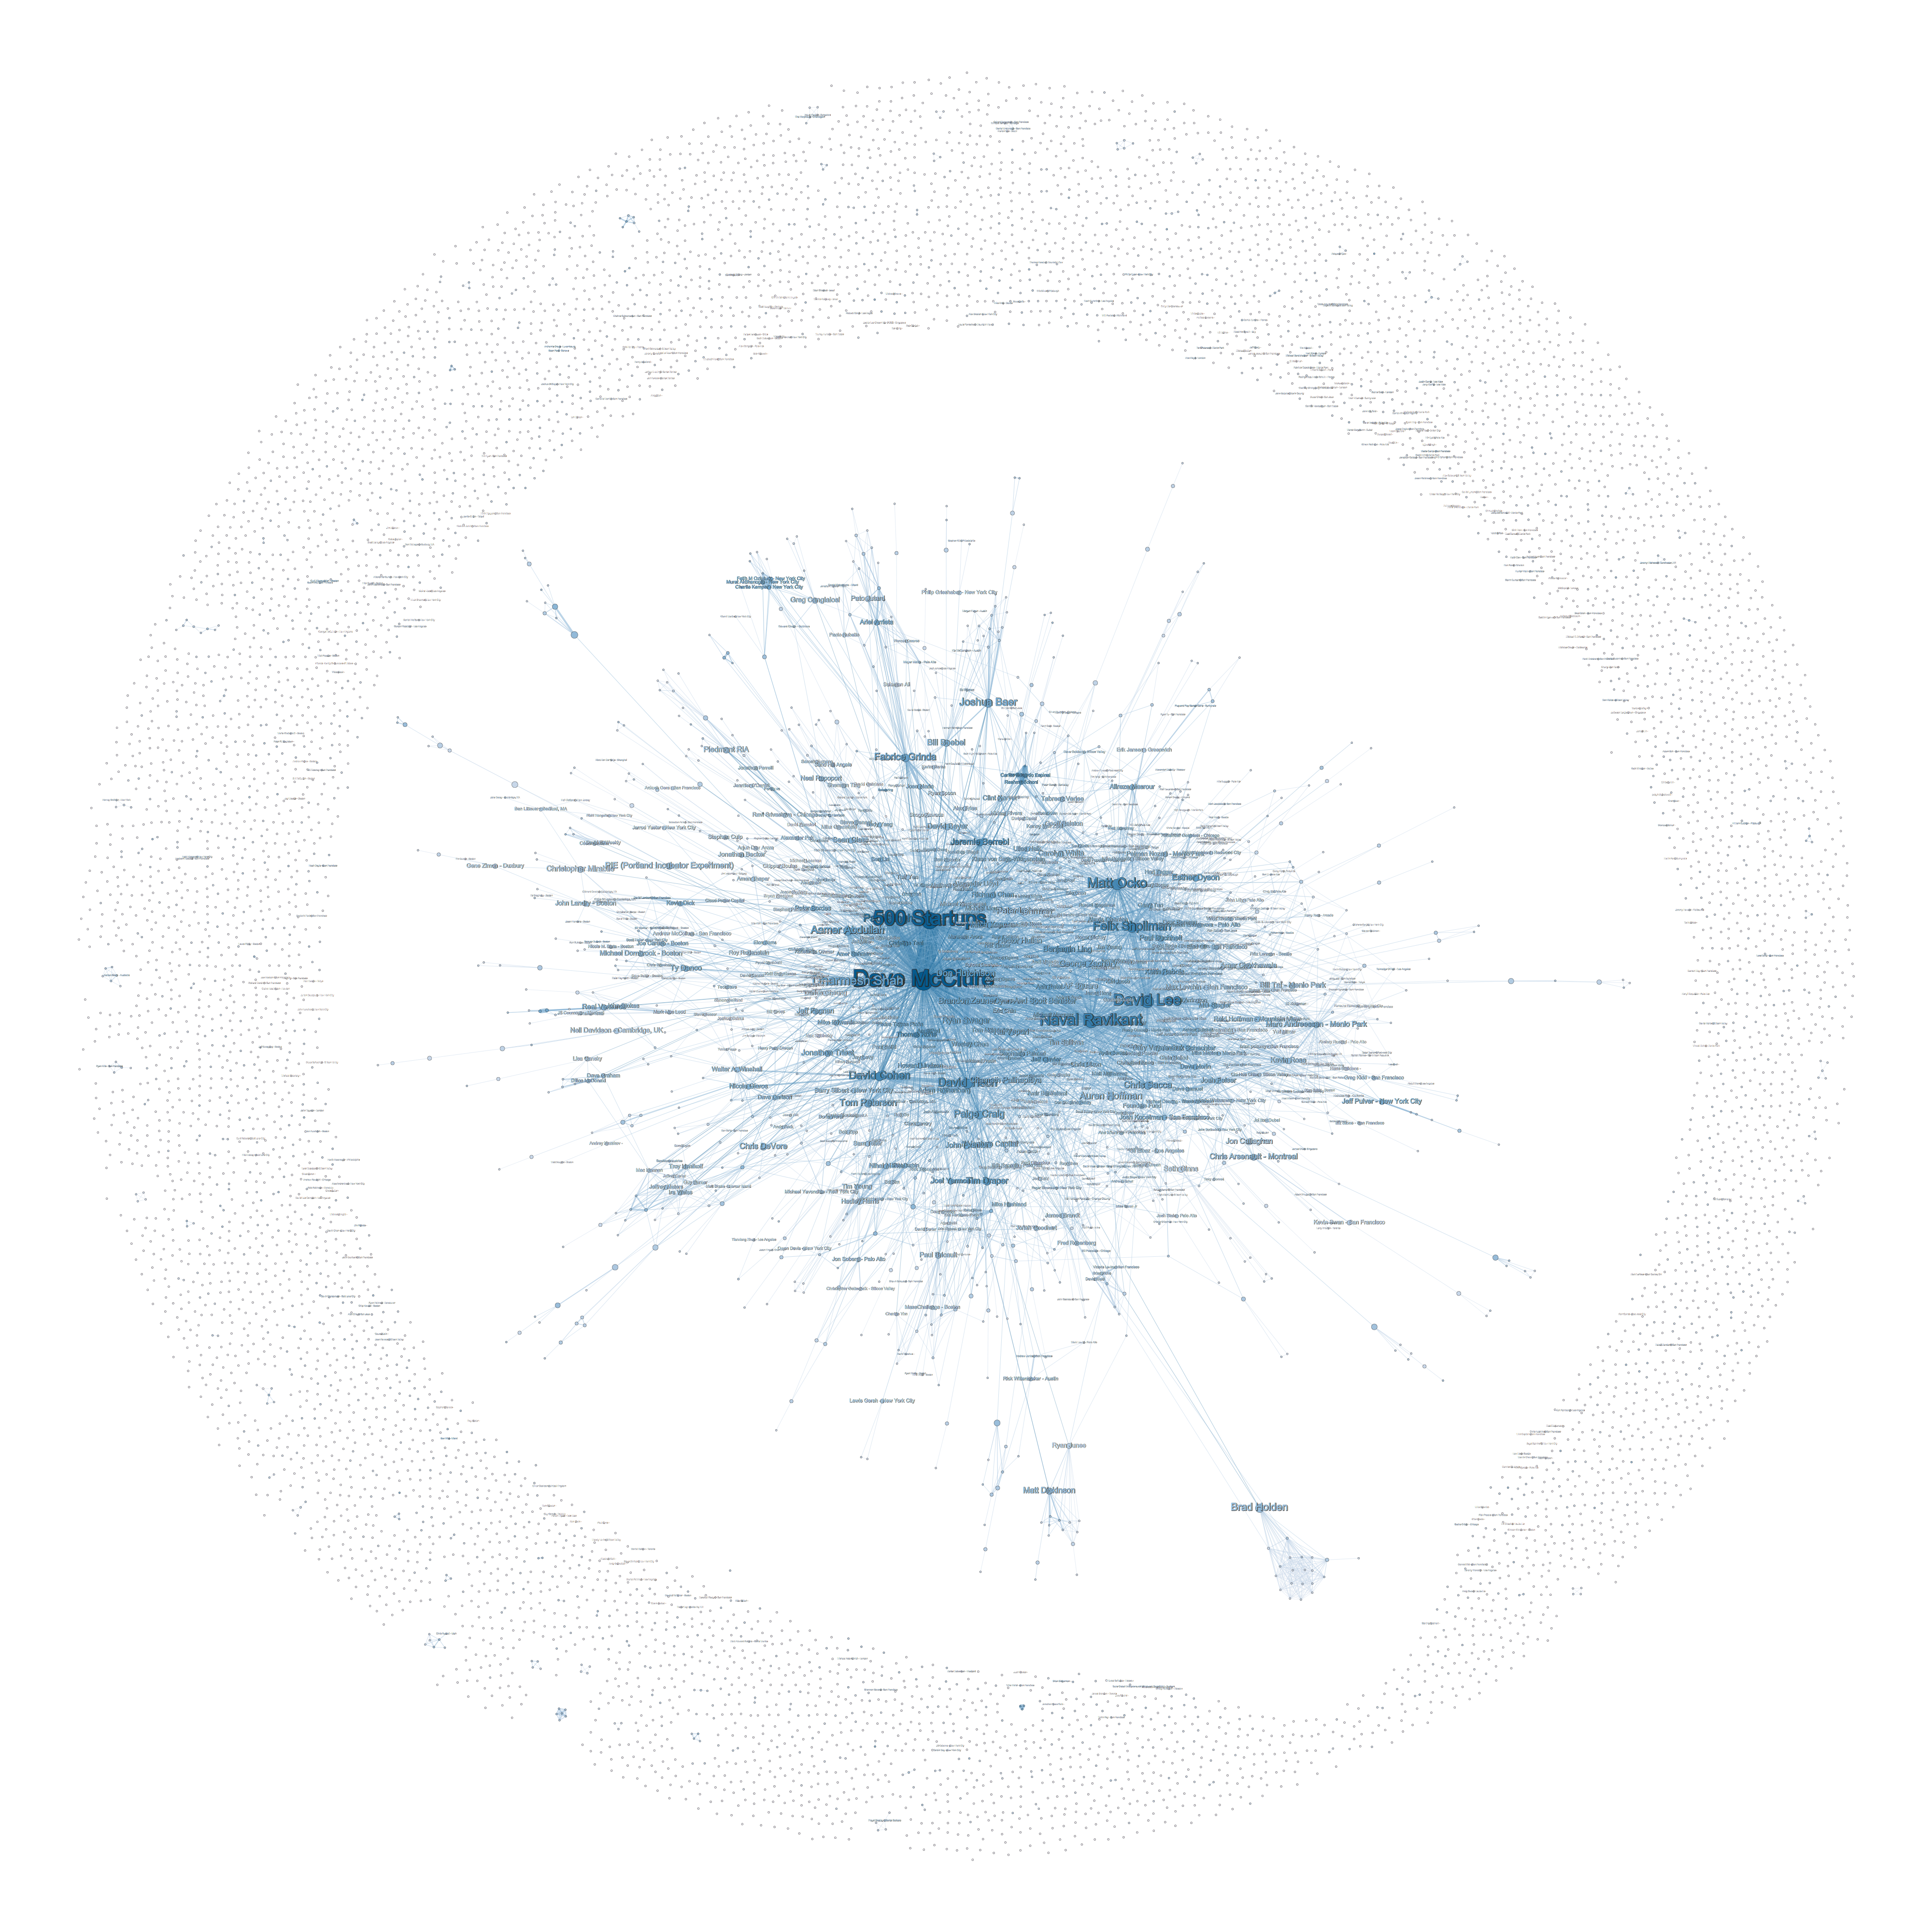
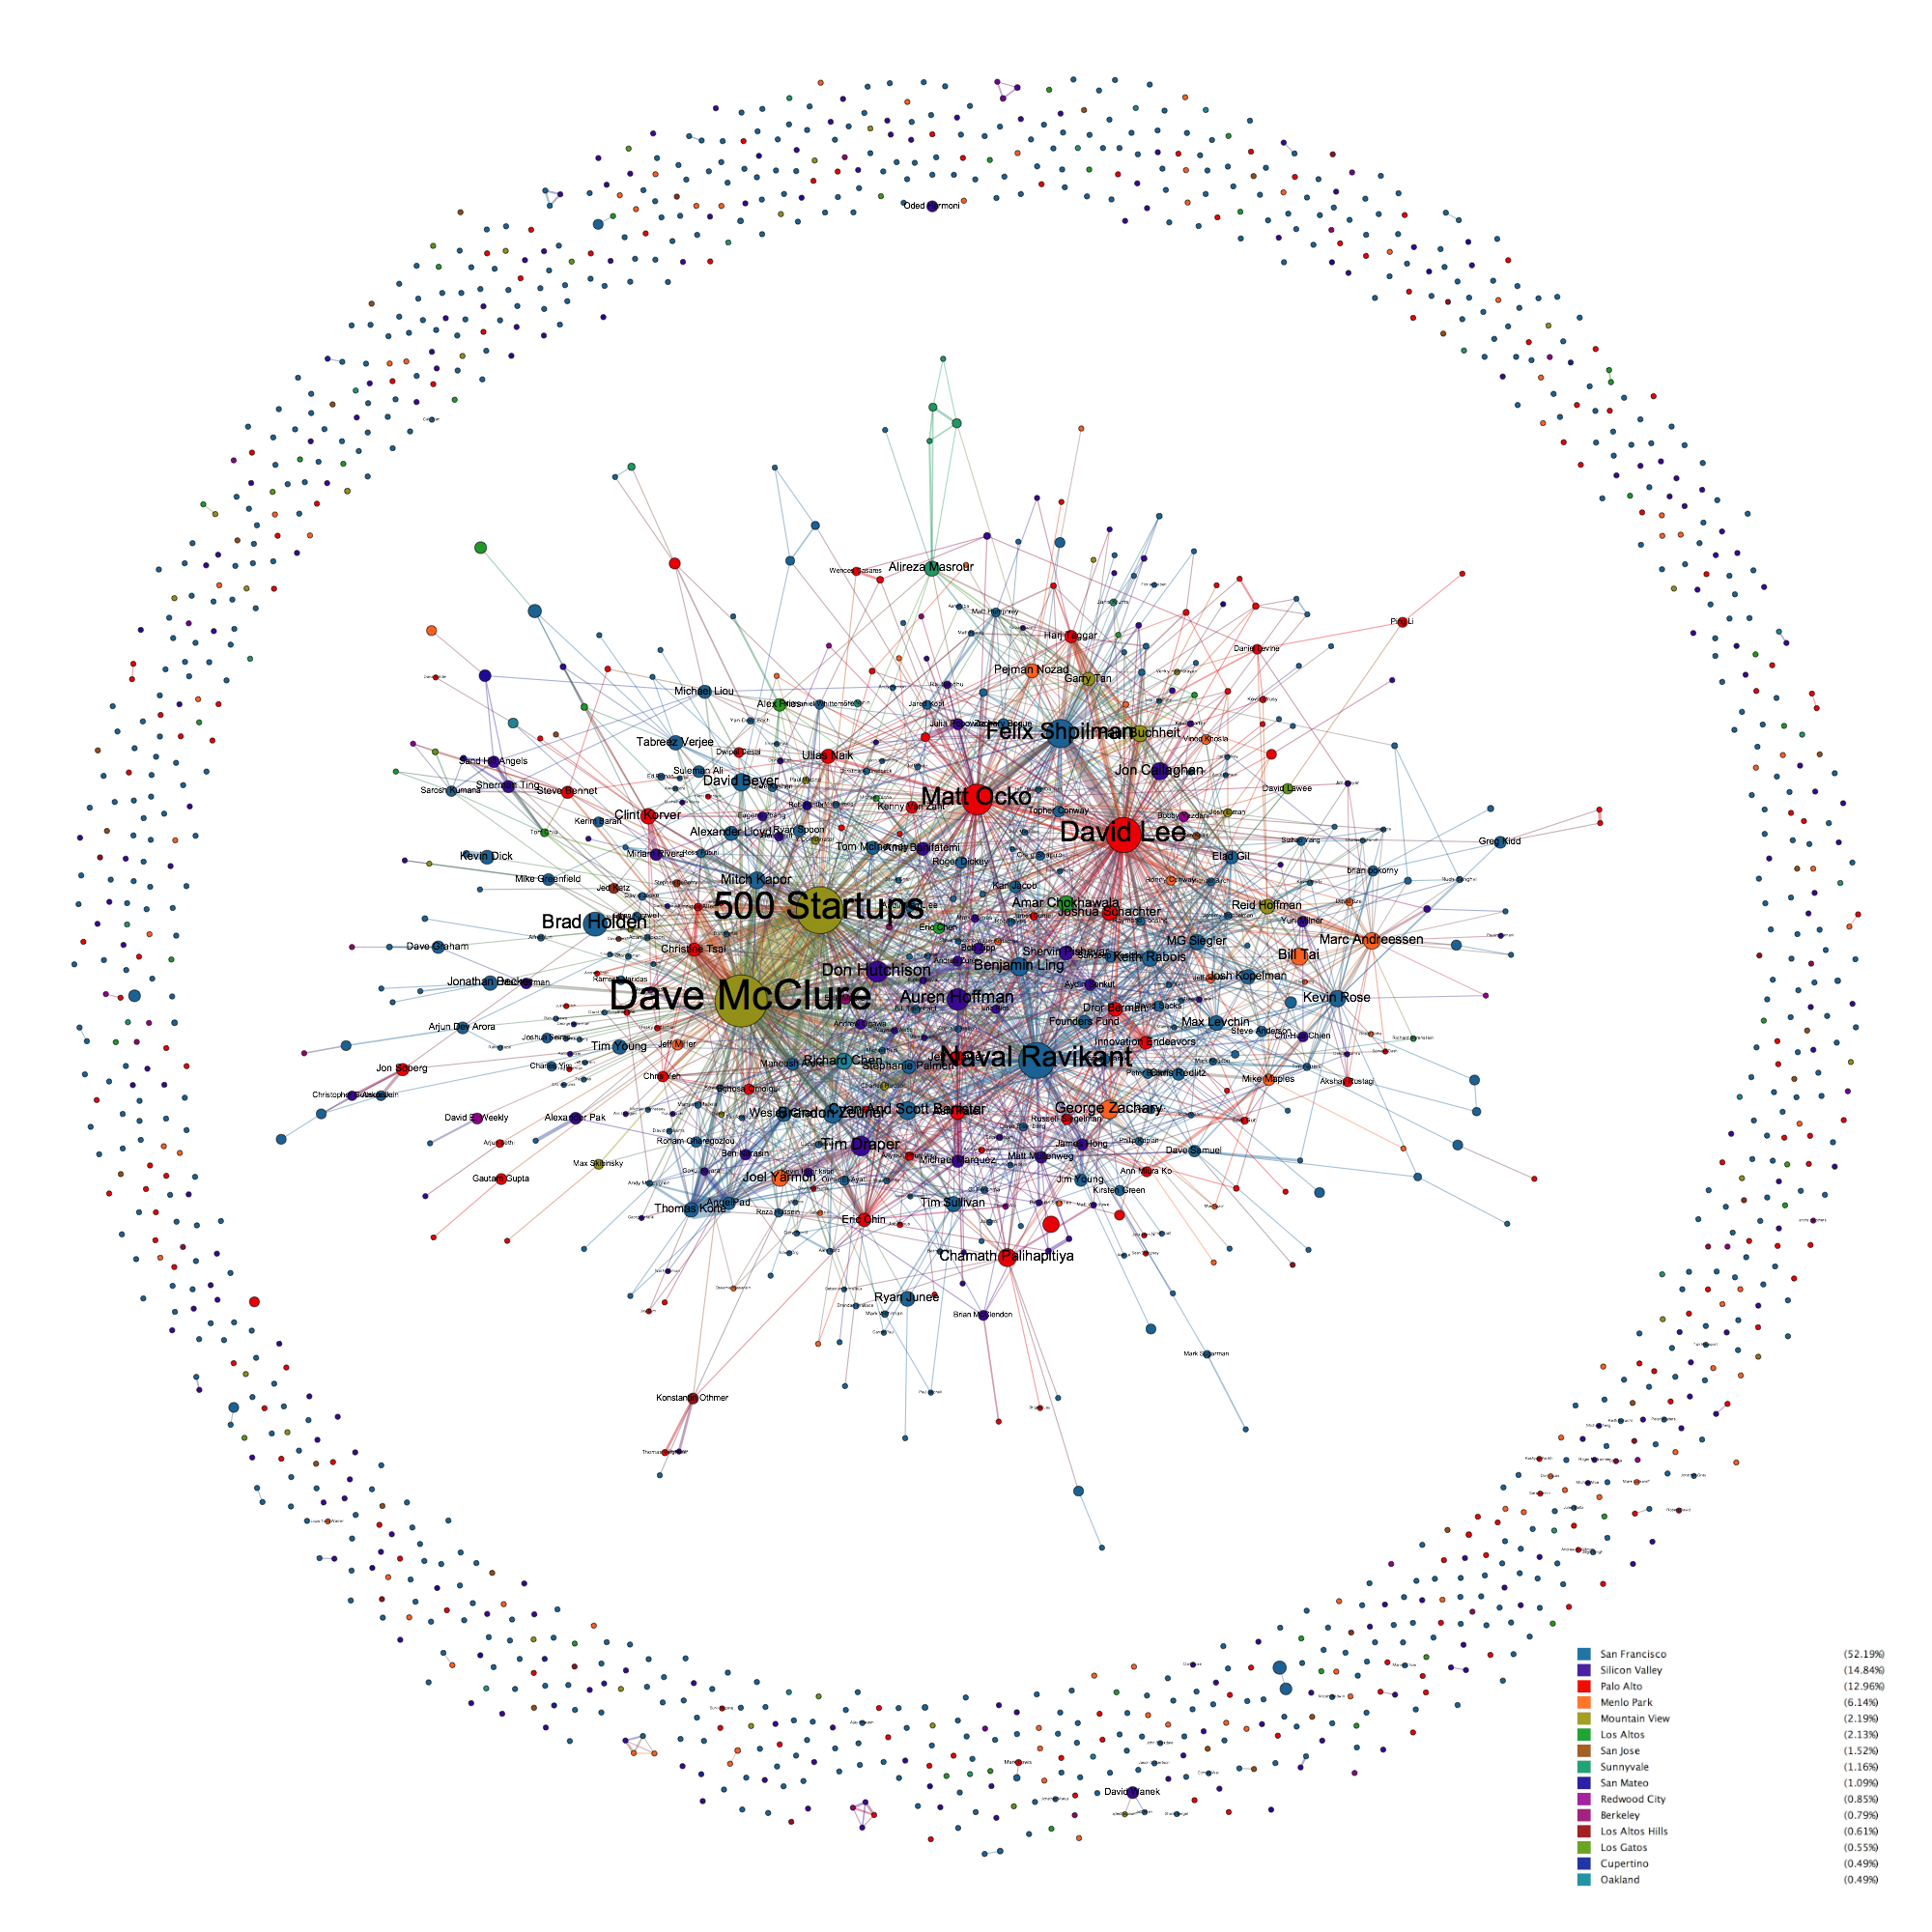
The network of investors with no threshold

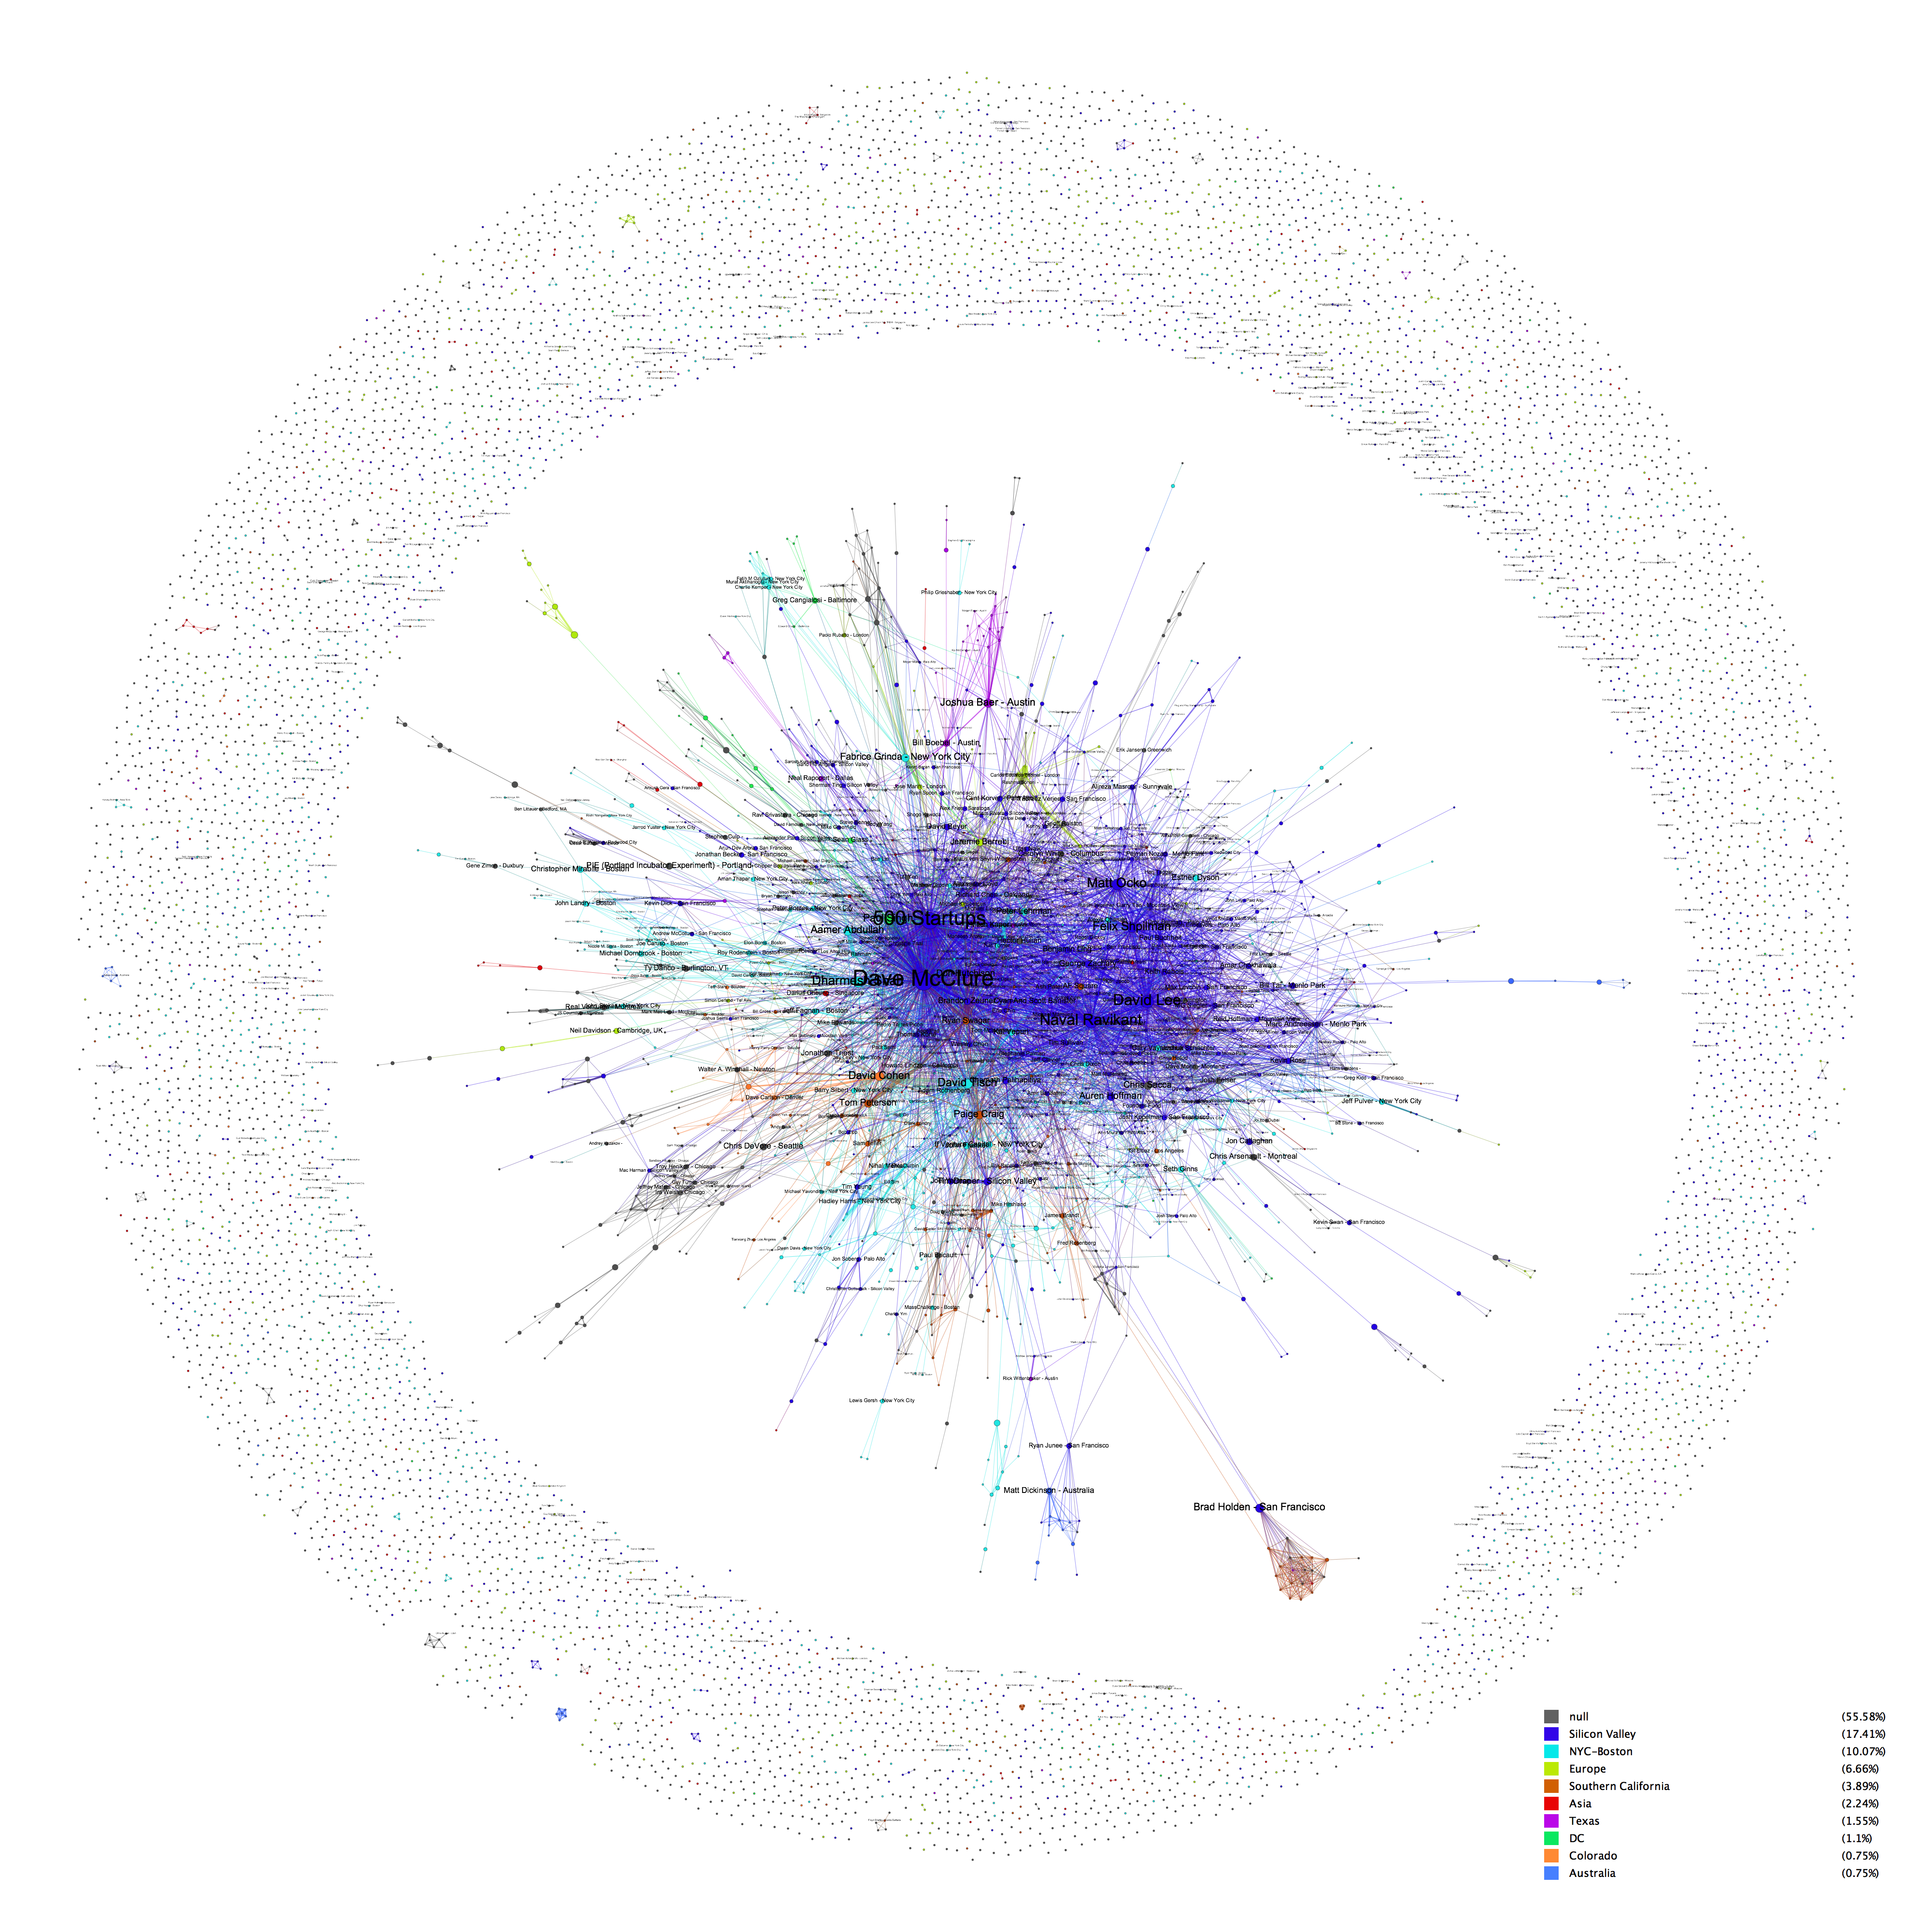
Filtered by edge weight, sized by betweenness centrality score, colored by meta locations

Filtered by edge weight, sized by betweenness centrality score, colored by meta locations

Results

Centrality of investors versus followers and number of companies invested

Sized by betweenness centrality score, colored by number of companies invested

Sized by betweenness centrality score, colored by number of companies invested

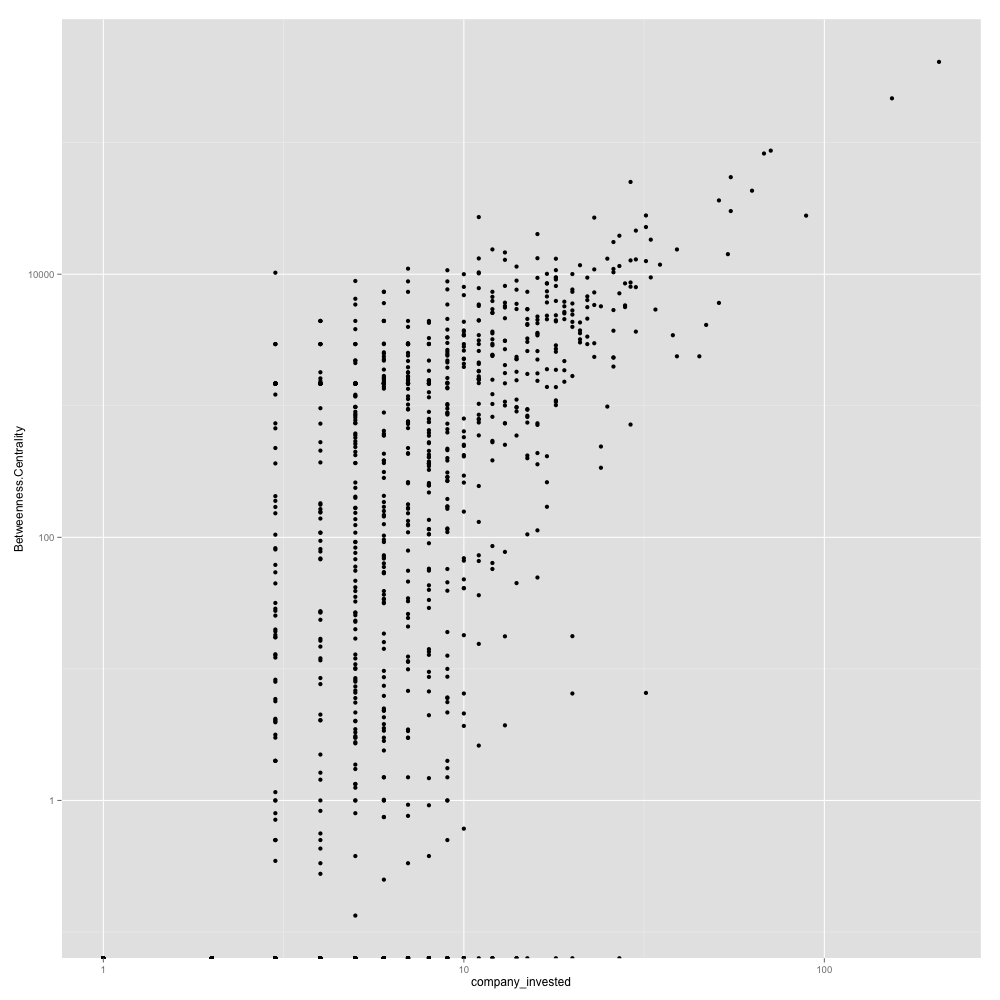
Scatterplot of betweenness centrality score and number of companies invested

Scatterplot of betweenness centrality score and number of companies invested

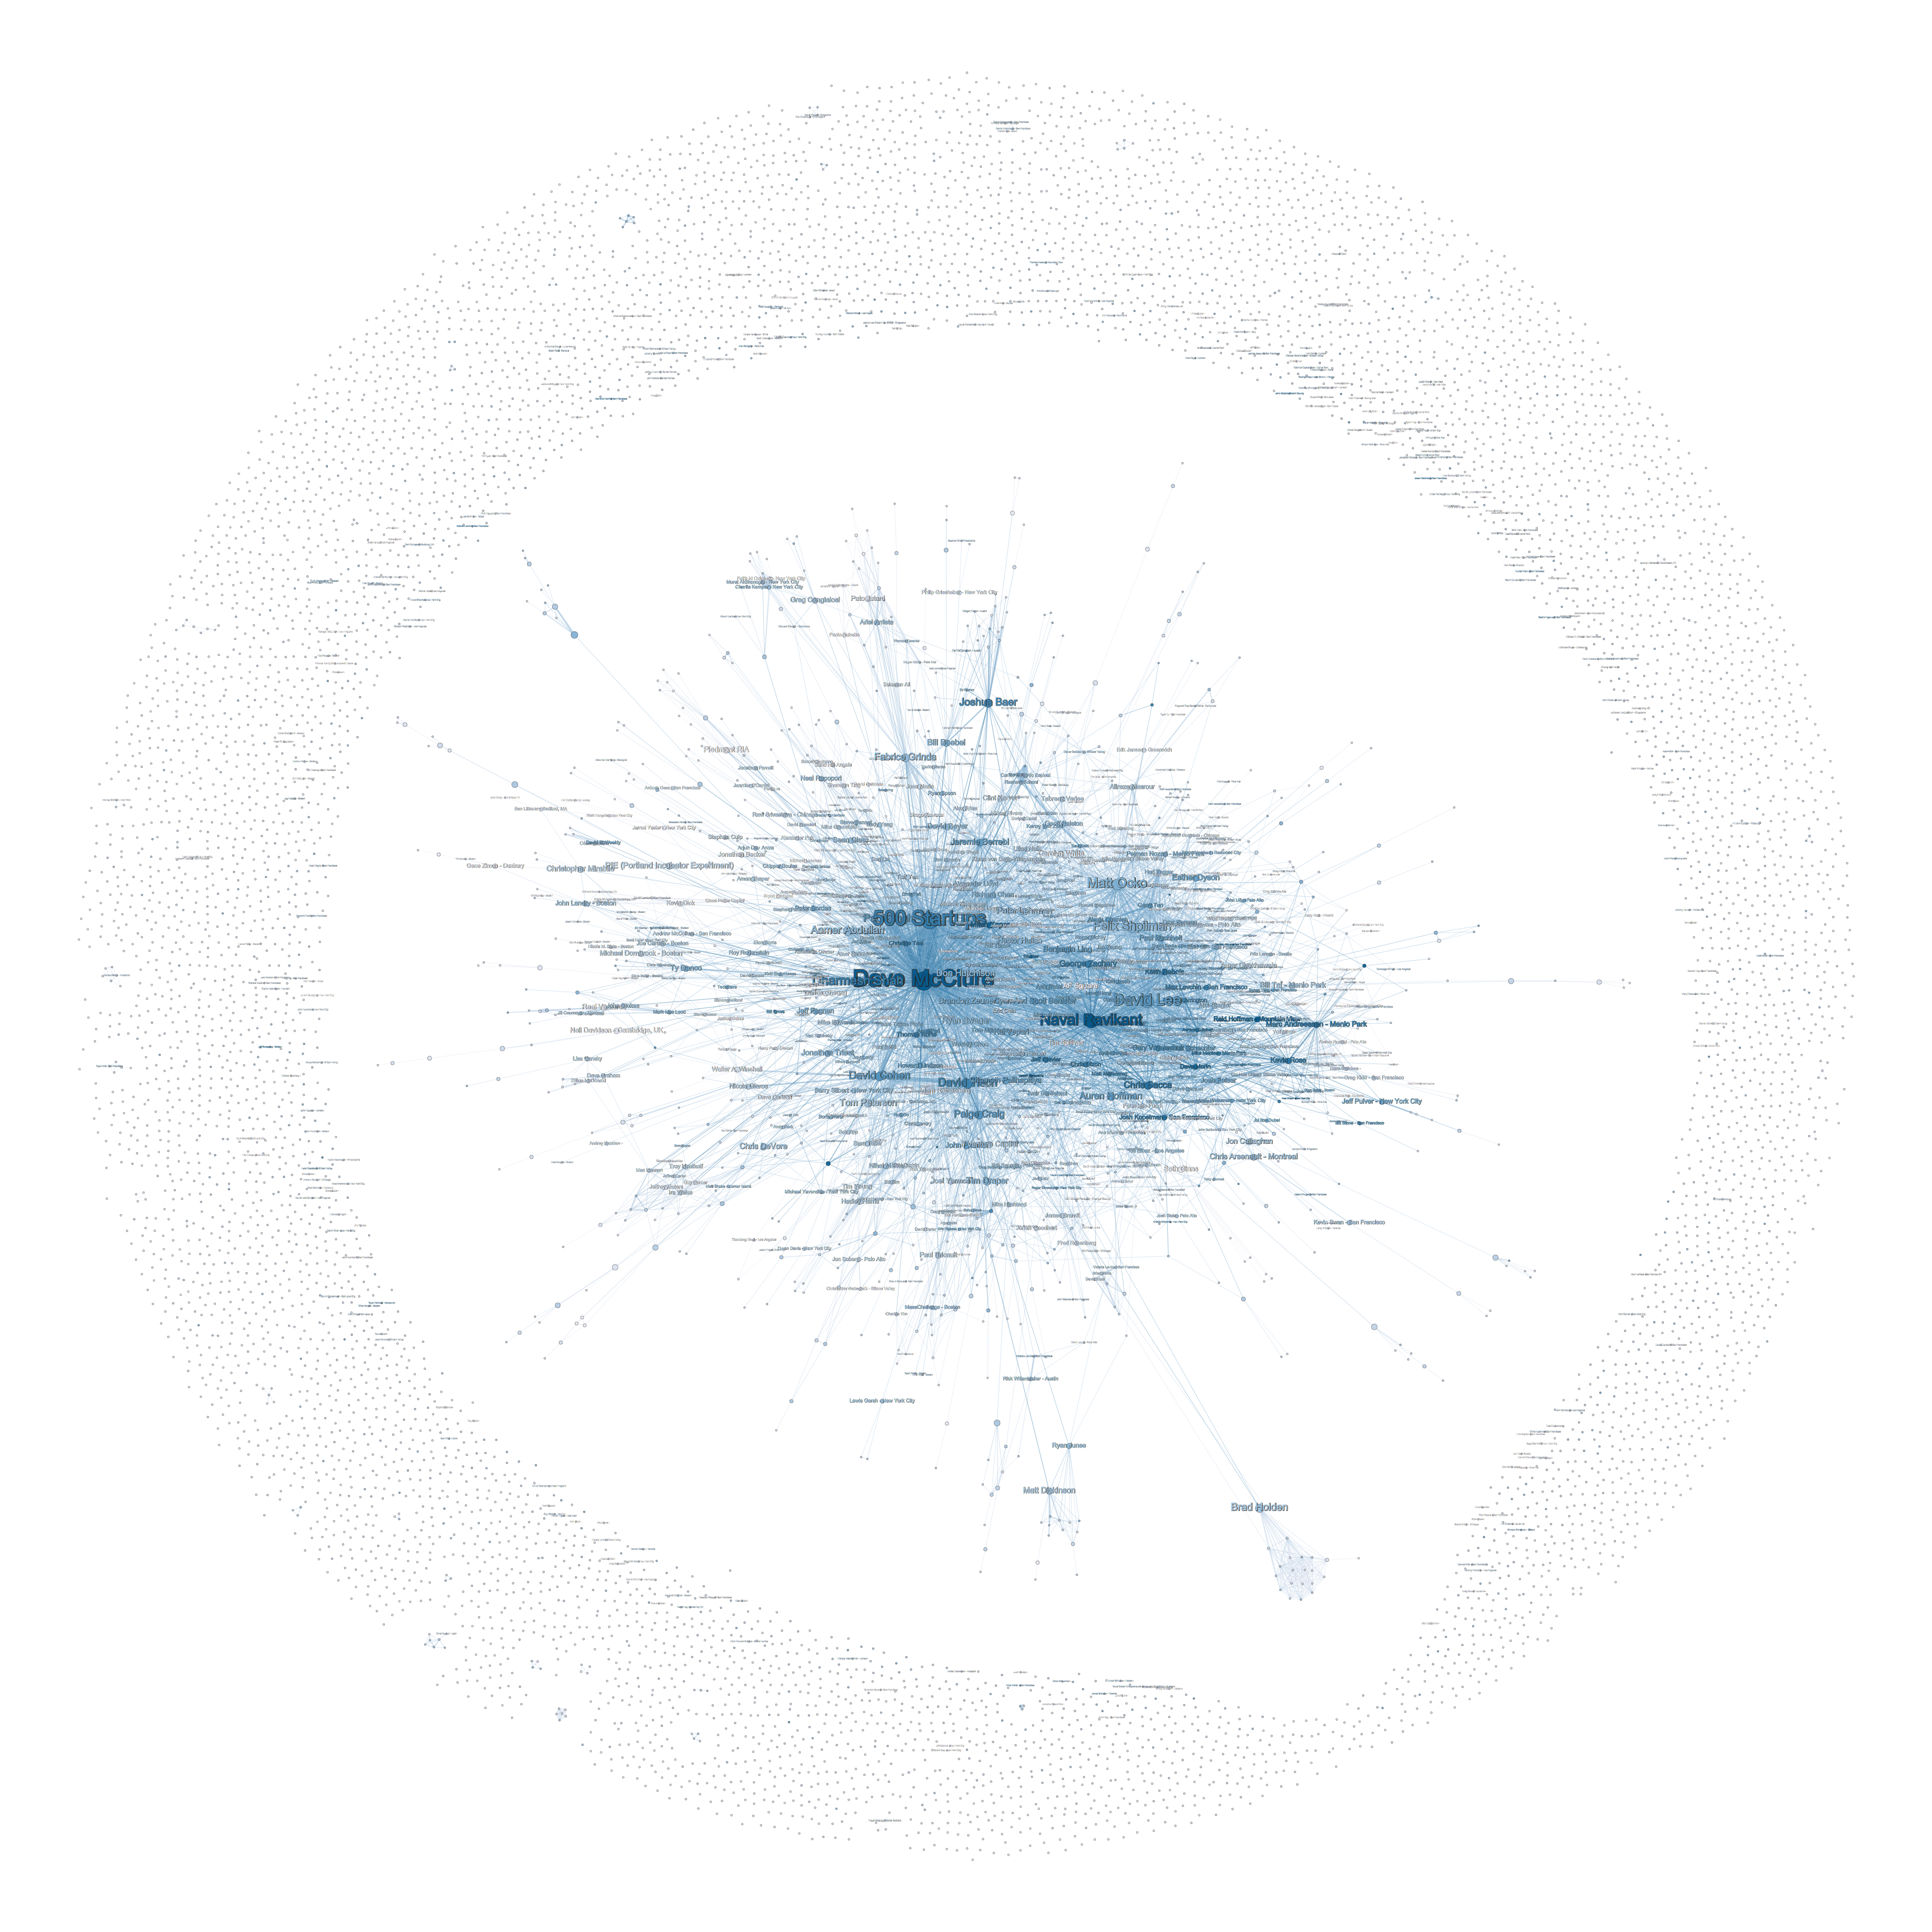
Sized by betweenness centrality score, colored by number of followers

Sized by betweenness centrality score, colored by number of followers

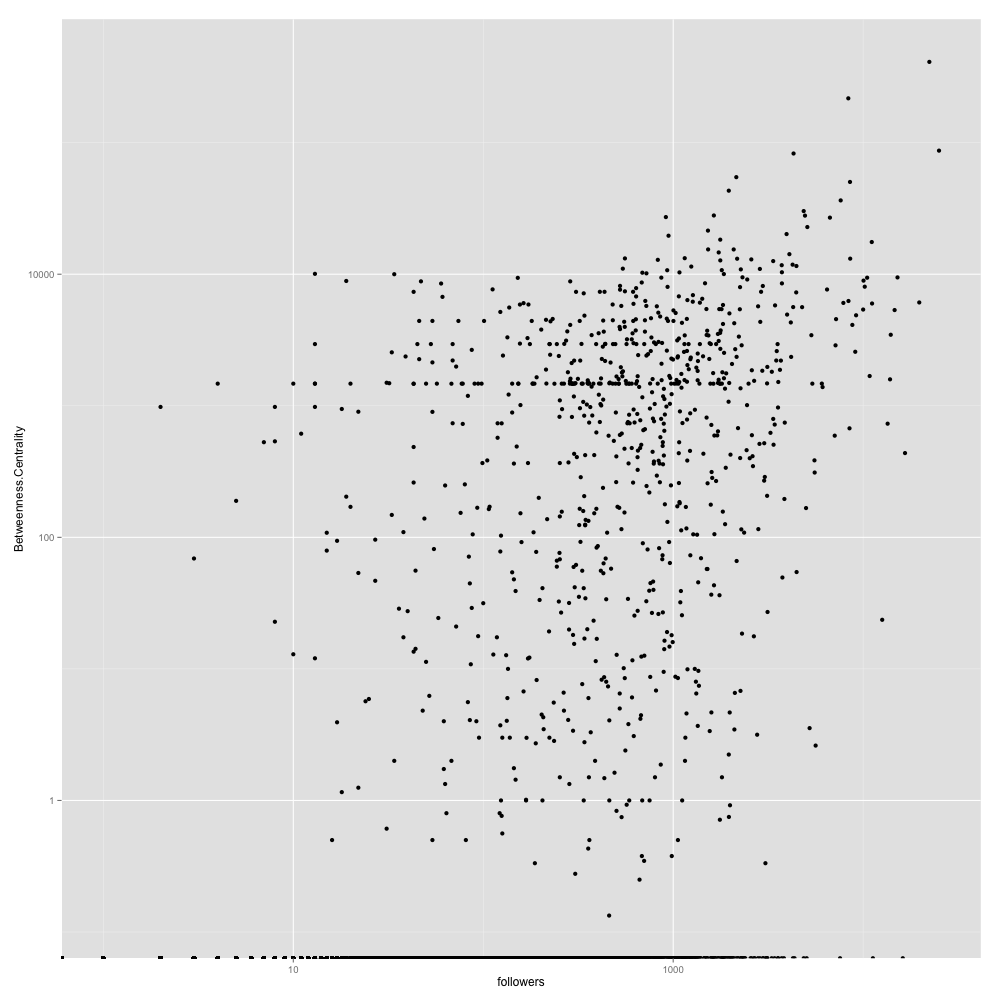
Scatterplot of betweenness centrality score and number of followers

Scatterplot of betweenness centrality score and number of followers


Both number of followers and number of companies invested have some correlation with betweenness centrality score. One with number of companies invested is expected since the network was generated using the co-investments.

Giant cluster of Silicon Valley investors

Closer look at the central cluster of Silicon Valley investors

Closer look at the central cluster of Silicon Valley investors

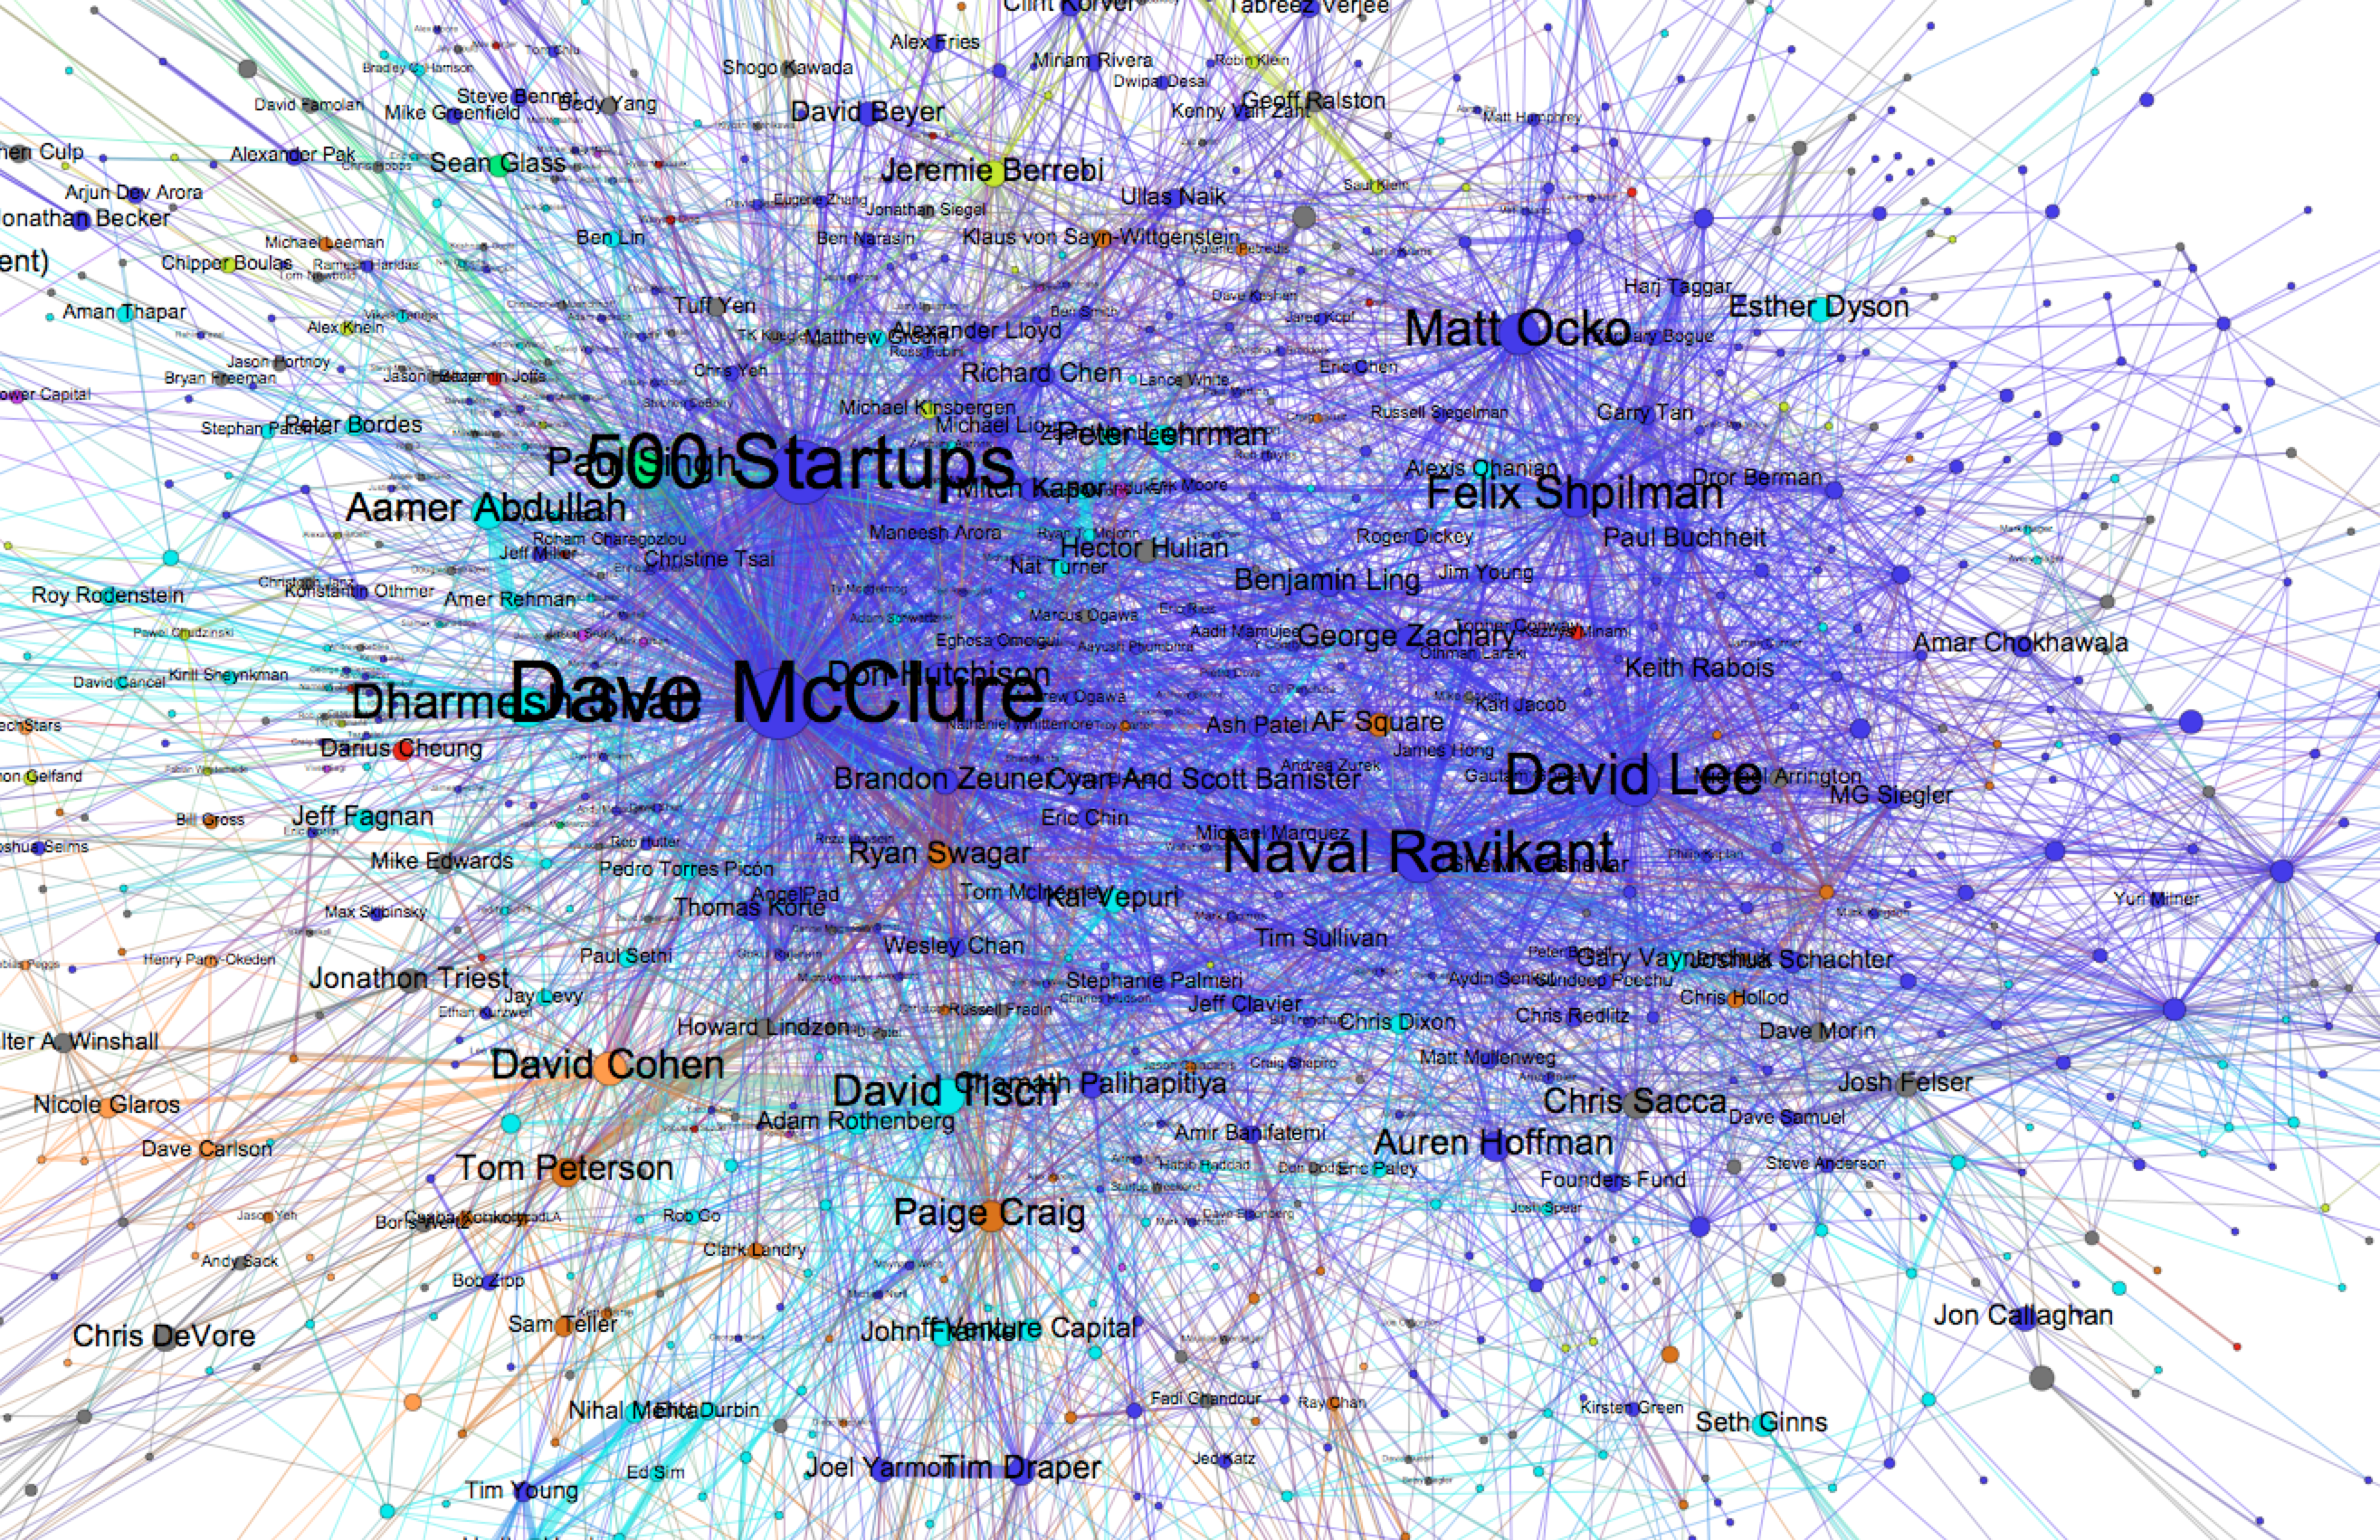
I don’t know whether AngelList data is skewed toward Silicon Valley investors or many investors list SV as a primary location even if they don’t live there but SV investors take large majority and they are very central. They are well-connected to pretty much every group and co-mingled with the second largest group, NYC/Boston investors(teal color).

David McClure and 500 Startups because of their number of investments, have the highest betweenness centrality scores and pretty much all other centrality measures.

Investors in within Silicon Valley region

Investors in within Silicon Valley region

Within Silicon Valley, there is no distinct sub-groups based on smaller regions.

Silicon Valley investors acting as hubs

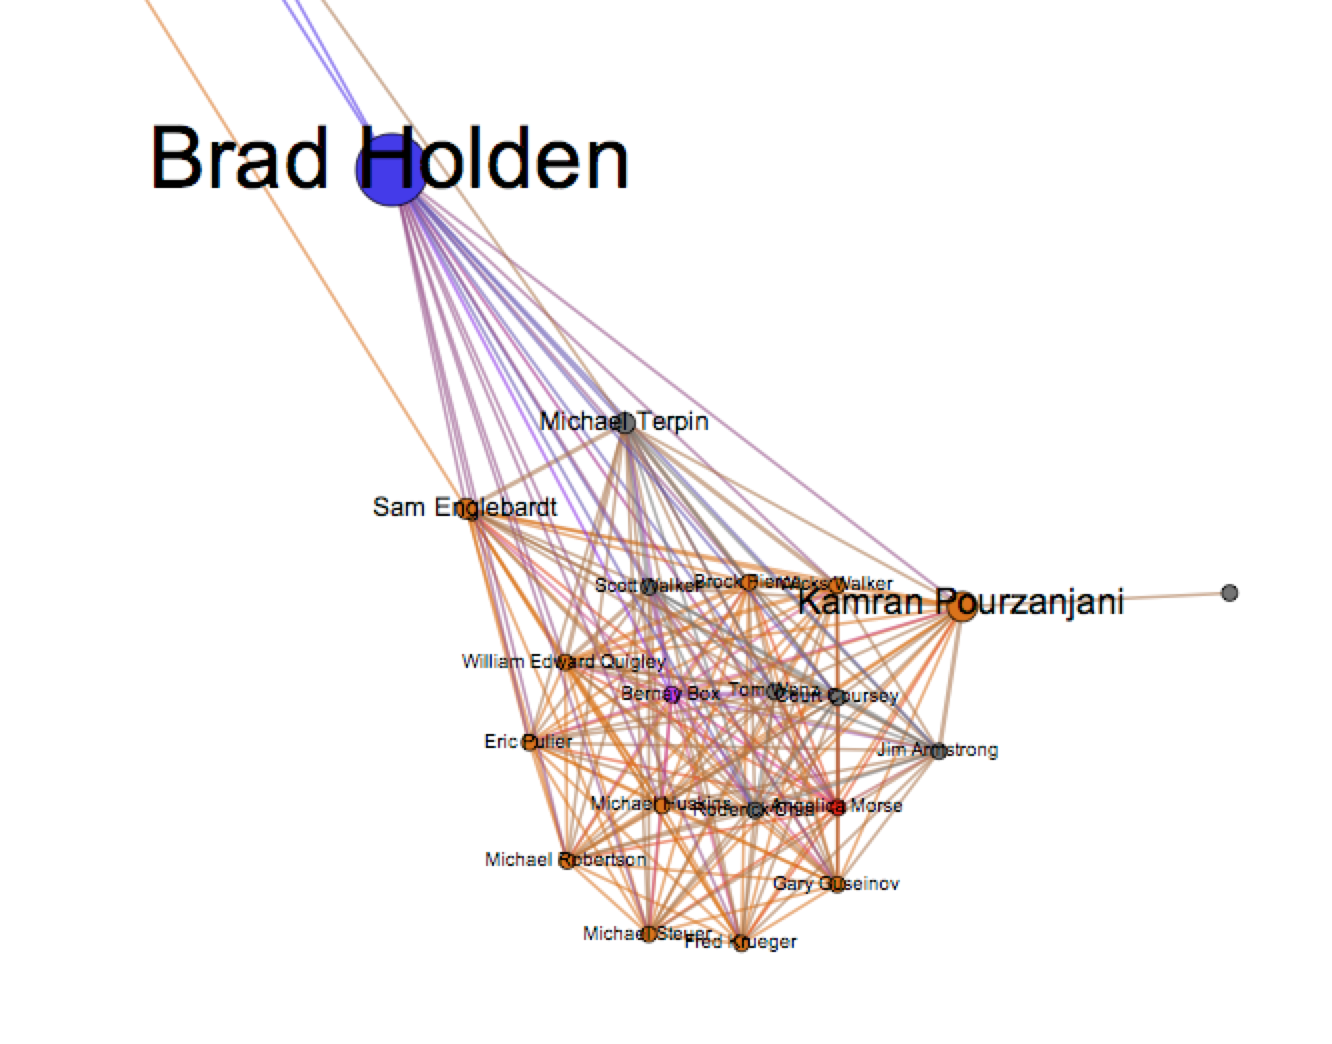
Brad Holden, a Silicon Valley investor is positioned to connect many Los Angeles based investors.

Brad Holden, a Silicon Valley investor is positioned to connect many Los Angeles based investors.

There are many examples of SV investors acting as hubs to other regional groups of investors. The most prominent one is Brad Holden(bottom right) who is connecting a very well-connected group of Los Angeles investors.

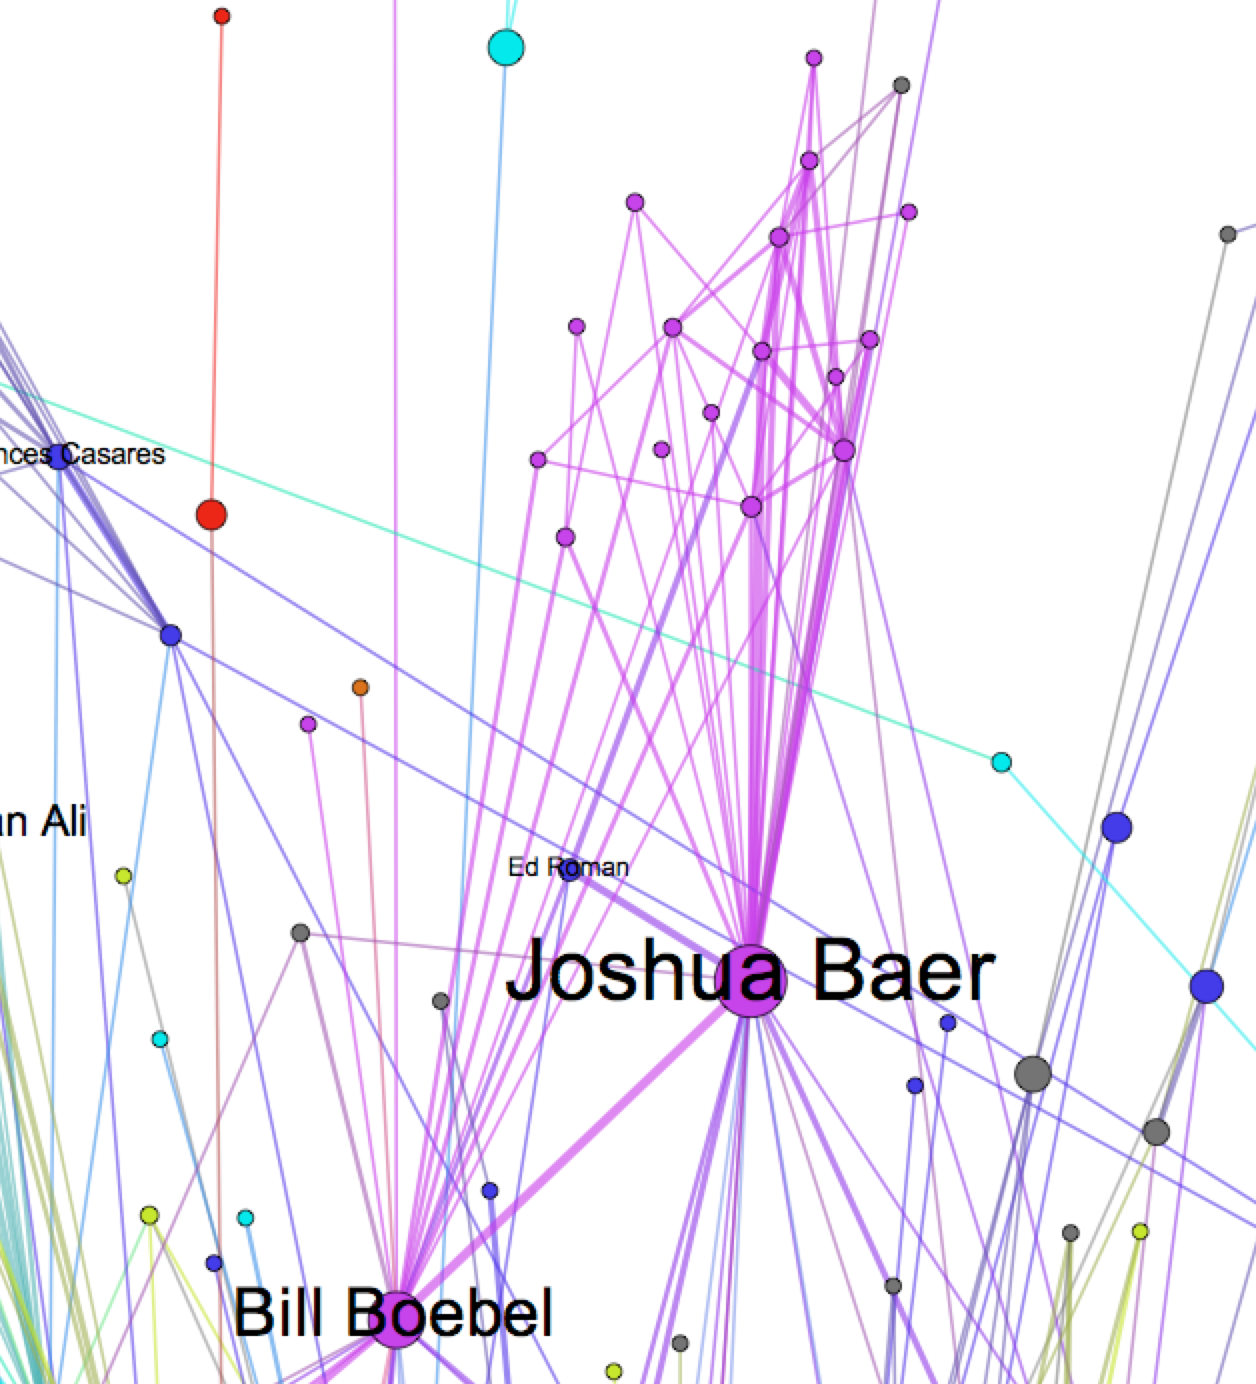
Joshua Baer is a Texas based investor who is connecting many investors in the same region.

Joshua Baer is a Texas based investor who is connecting many investors in the same region.

Another example is an investor who is based in a region outside of Silicon Valley but has made many investments with SV investors acting as a hub to regional investors. Joshua Baer(top center) and Bill Boebel are both are based in Texas but have many co-investment connections with SV investors are connecting other Texas based investors.

Ideas for Further Analysis

I wish I was able to get some temporal information to do more advanced analysis such as

  • A group of investors acting as flocks – How does certain attributes of investors inform/motivate other investors to act together?
  • How does information about startups disperse between investors?

Shout Out

  • Babak Nivi(@nivi) for suggestion of ideas.
  • Joshua Slayton(@joshuaxls) for answering questions and accommodating additional data requests.

Thank you friends.

I want to thank everyone who was kind enough to make introductions to companies/people for opportunities.
After talking to various companies, I am joining Spokeo as a data scientist to analyze their dataset.

I intentionally didn’t find a job after my last employment(well, at least partially). It was a great experiment for me to try breaking out of a financial comfort zone. I wouldn’t say that I succeeded but it was good enough to make me realize that “what I do STILL defines a large part of my identity”.

I hope to try this again and someday, I will learn how to “embrace the uncertainty!”

Again, thank you everyone for this valuable lesson. =)

How I built HN Browser(my first iOS app)

I am going to share my experience building an iOS app for the first time.

3421

First some high-level summary.

  • iTunes App Store Linkhttps://itunes.apple.com/us/app/hn-browser/id578535095?ls=1&mt=8
  • Project start date : Mid October
  • Code start date : October 26th
  • First submission to App Store : November 14th
  • First approval : November 30th
  • Total hours : ~80 hours
  • Commits : 35
  • Tools used : github, xcode, asana, photoshop, testflight

Research phase (~30 hours)

I had some understanding about what was involved in application building in web but have never written an native mobile application before. Not only I had to familiarize myself with Objective-C syntax but had to learn about iOS SDK.

For the developers who are new to iOS development, I would recommend to follow some tutorials on the web.

  • http://mobile.tutsplus.com/tutorials/iphone/learn-objective-c-day-1/
  • http://www.otierney.net/objective-c.html

Once I was familiar with Objective-C syntax, I also started reading/watching tutorials for iOS SDK. There are many tutorials on the web including YouTube videos but I found iOS SDK essential training on lynda.com very helpful. So I watched all sessions and followed code examples. It was very important to follow code examples because often times there are hidden steps in explanations to avoid redundancy.

  • http://www.youtube.com/results?search_query=ios+sdk+tutorial&oq=ios+sdk
  • http://www.lynda.com/iOS-tutorials/iOS-SDK-Essential-Training/92179-2.html

While I was learning about iOS and Objective-C, I spent some time to look at many screenshots of iPhone apps. It was important to identify different components of iOS applications so I could decompose them in my head to identify which UI elements were used. Good resource for this is iTunes app store and dribbble.com.

  • http://www.apple.com/itunes/charts/free-apps/ – it is better to use iTunes for browsing
  • http://dribbble.com/search?q=iphone

Coding Phase (~30 hours)

I came up with a name of the app(HackerNews Reader) to begin followed by a git repo on github and a project in Asana in order to keep track of tasks involved in building an app. One key lesson I learned was YOU SHOULD RESERVE YOUR APP NAME IN ITUNES CONNECT FIRST! I had to go through a lot of changes later because the app name wasn’t available in iTunes connect.

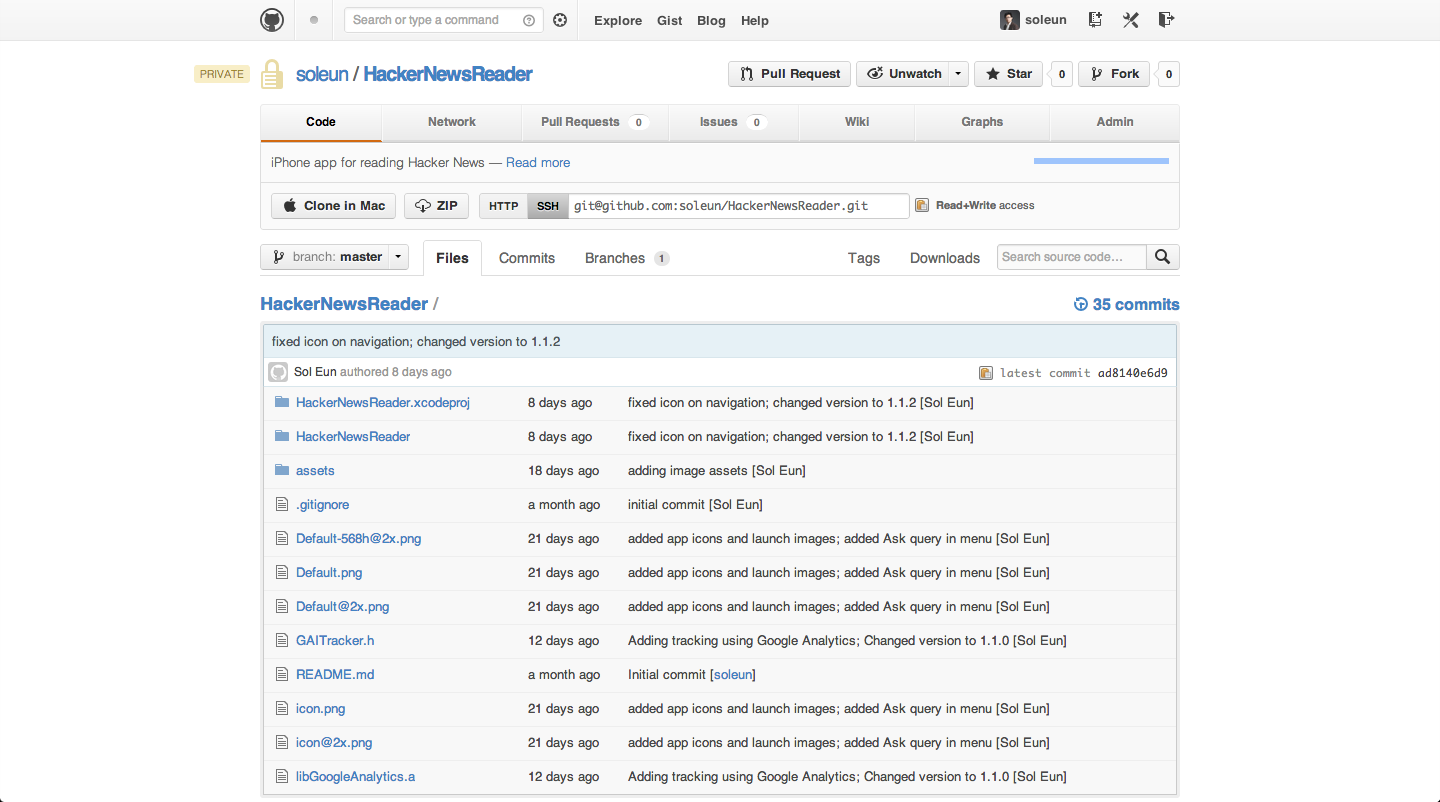
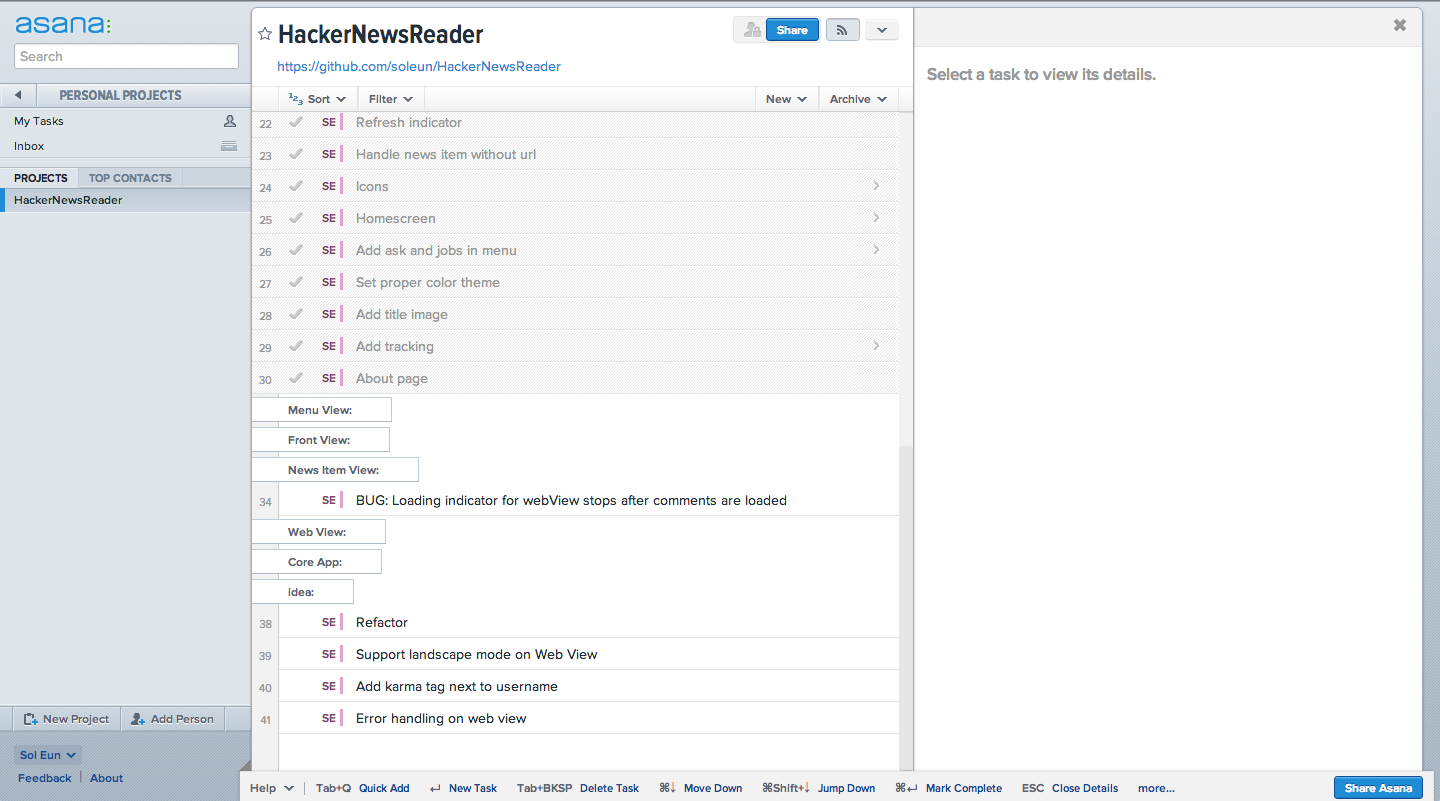
Screen Shot 2012-11-30 at 10.40.10 PMScreen Shot 2012-11-30 at 10.39.48 PM

I had a rule that I set with myself. At least one commit everyday. This rule was crucial for me to finish this app. I had a few iterations on the design but because the app itself was simple, I didn’t have to go through any dramatic change. The most time consuming part of coding was UI and I suspect it is because I wasn’t familiar with UI components in iOS SDK.

When I had problems, like everyone else, I searched Google and Stack Overflow. I will list some examples below.

  • http://stackoverflow.com/questions/5151250/iphone-expand-and-collapse-a-uiview-programmatically
  • http://www.intertech.com/Blog/Post/iOS-6-Pull-to-Refresh-(UIRefreshControl).aspx
  • http://www.cimgf.com/2009/09/23/uitableviewcell-dynamic-height/

As you can see, some of them are elementary but I had no idea how to implement because lack of knowledge on iOS SDK.

Launch/Test Phase (~20 hours)

I primarily used iPhone simulator and TestFlight to test on my iPhone.

  • http://testflight.com

My app was rejected once but it was hard to understand why. It said something like

We found the following issues with the user interface of your app:

Specifically, the app did not include iOS features. For example, it would be appropriate to use native iOS buttons and iOS features other than just web views, Push Notifications, or sharing.

So I added activityViewController so users can share article through Facebook, Email, and Twitter

  • http://developer.apple.com/library/ios/#documentation/UIKit/Reference/UIActivityViewController_Class/Reference/Reference.html#//apple_ref/occ/cl/UIActivityViewController
  • http://ioscreator.com/social-sharing-in-ios-6-the-activity-viewcontroller/

And finally it was approved!

It was a lot of fun and I will continue to build something while I am learning more. I hope this post helps anyone who is thinking about building a mobile application.

Using Gephi to understand Gephi

I have been playing with an opensource software called Gephi for several months. I believe it is one of the best non-proprietary network visualization softwares currently out there. Gephi allows users to visualize, navigate and understand relational dataset such as social network data, quickly and efficiently. 0.8 beta which was just released less than a week ago includes some major enhancements and bug fixes.

Gephi is fairly big project with large sourcecode base. If you want to write plugins or modify sourcecode, it could be overwhelming in the beginning. Once you understand the structure, it gets easier but still non-trivial.

I was once trying to wrap my head around the structure of Gephi sourcecode and I thought it would be interesting to use Gephi to understand Gephi sourcecode.

I wrote a small script in Ruby to go through the sourcecode and lookfor import statement and created list of directional links from one class to the other. I made the script output a network file which I can open in Gephi to visualize. Since I was only interested in Gephi project, I decided to narrow down the scope to org.gephi only.

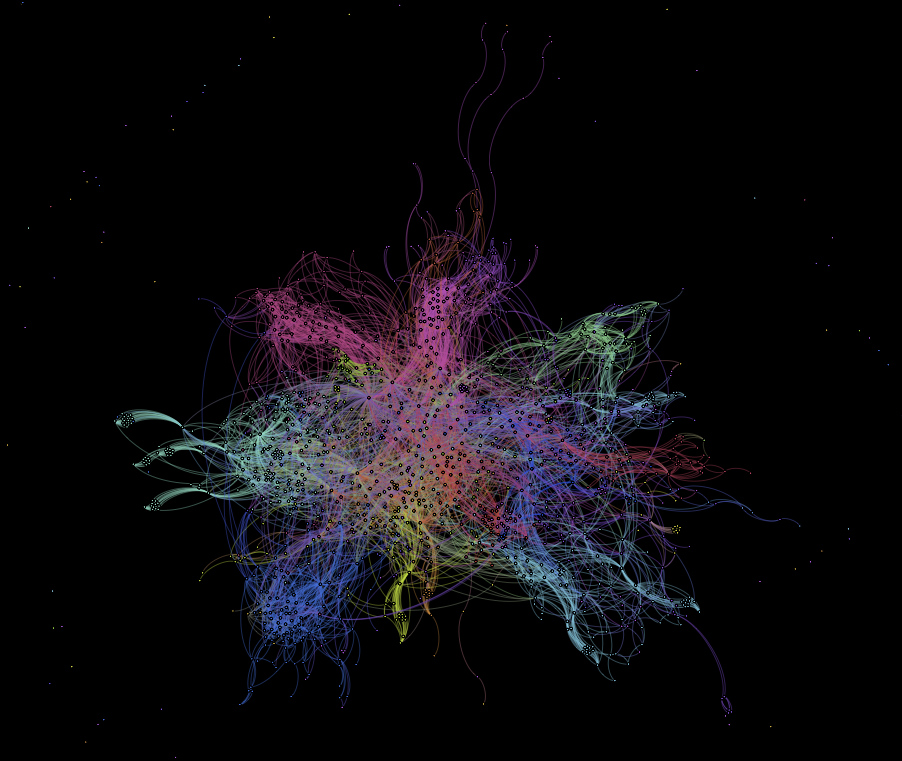
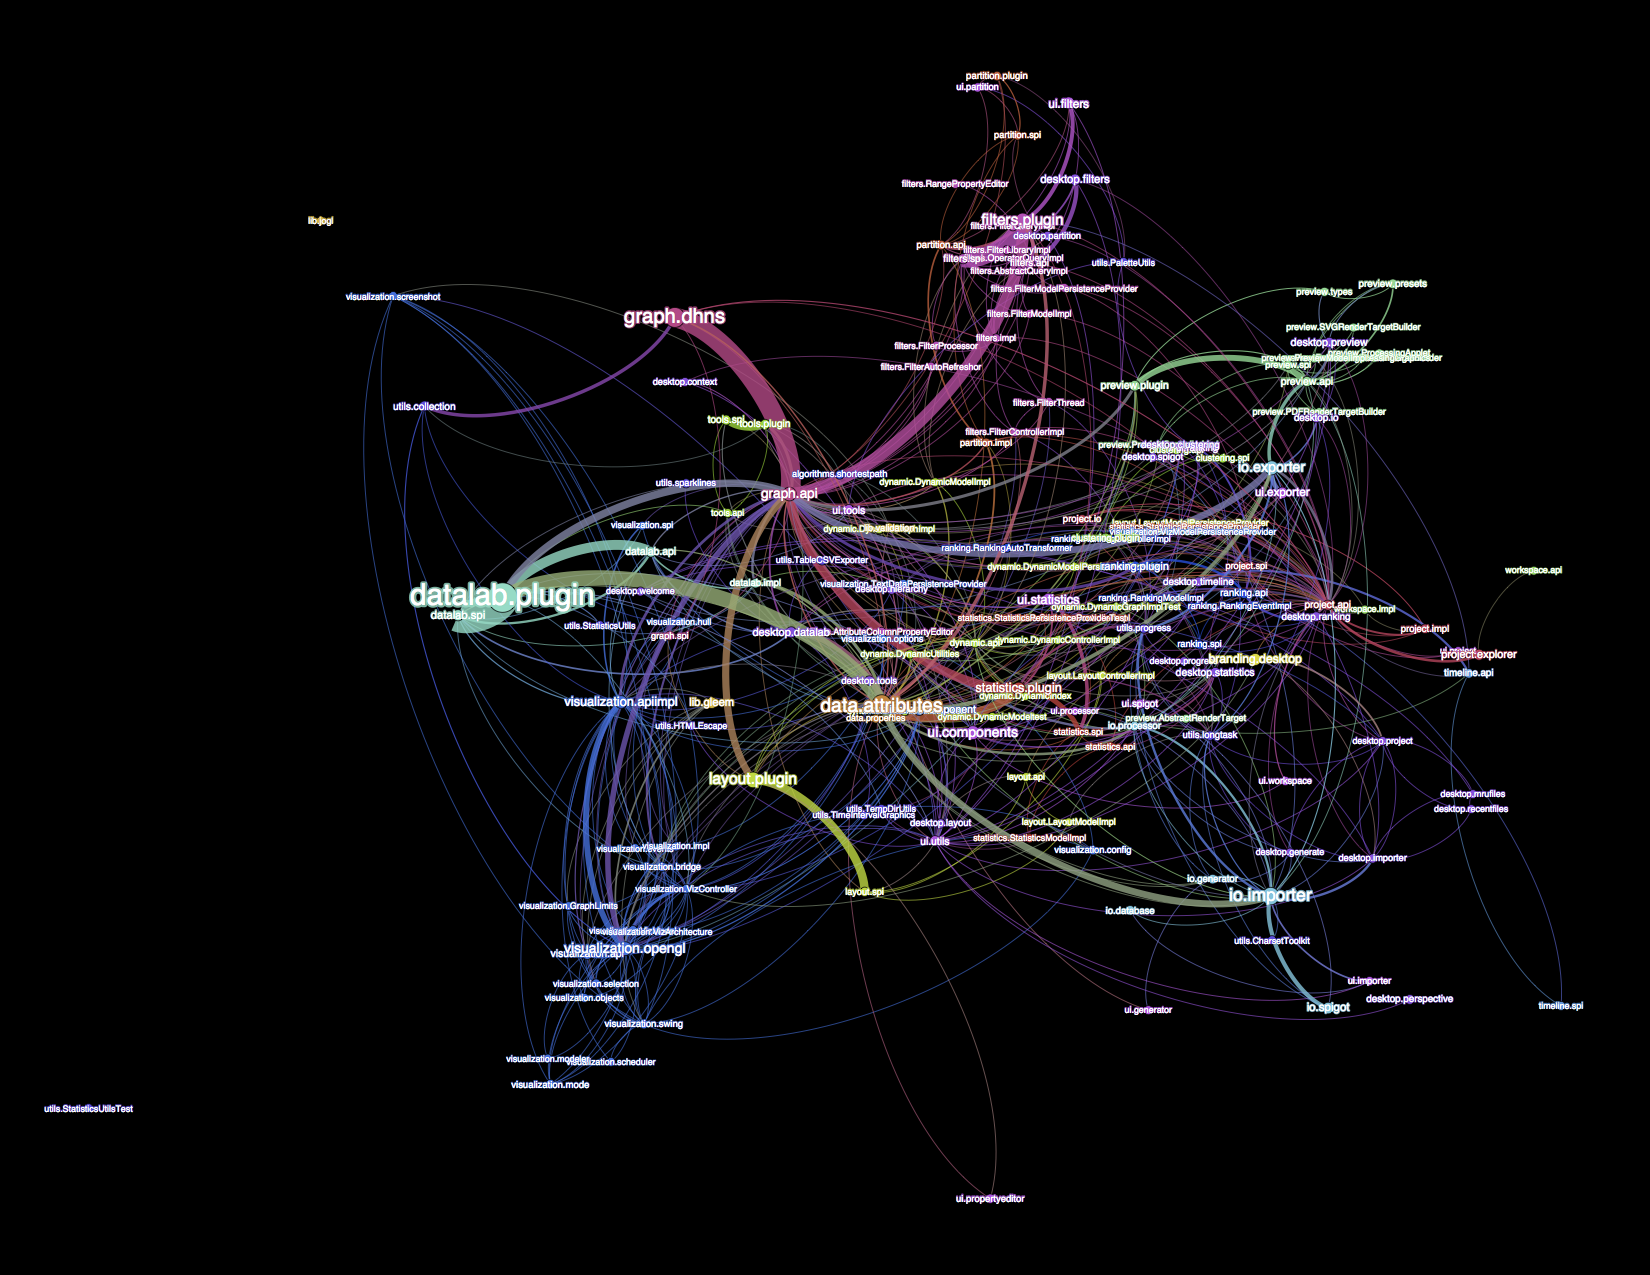
I ran one of the built-in layout algorithm, ForceAtlas 2, and colored the network by top-level module(below). Besides a pretty picture, you can see some clusters in the network but center of the network looks like there are many cross referencing.

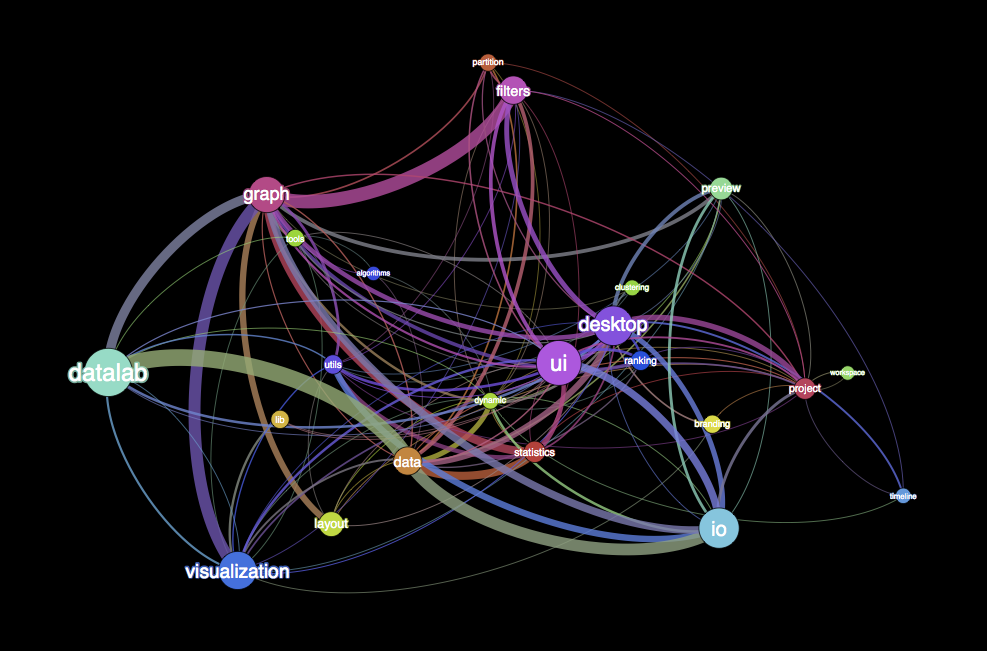
In order to see more structure in the network, I grouped nodes based on their membership to modules(below). This shows inter-module dependencies of the sourcecode which is very interesting. Nodes are sized by the number of sub-classes and the thickness of edges represent the number of classes connecting different groups in this case, modules. You can see datalab being the largest module based on the number of sub-classes. The average degree is 10.6 which means, if you change sourcecode of a module, you have an average of 10.6 modules you should consider to make sure you don’t have any compatibility issue.

Last picture(below) shows a slightly granular view. Nodes are broken down by one sub-level. In this view, average degree is 7.7.

This was a helpful exercise for me. If I get a chance, I can do this for all previous versions of Gephi to visualize the project’s evolvement.

iOS 4 Multi-tasking UI Suggestion

So I ended up getting an iPhone 4 on Oct 1.
I like it. Screen is gorgeous, it is faster, etc.
But one thing I don’t like about the iOS 4 is the way it handles multi-tasking:

1. Launch an application.
2. Launch another application.
3. Double tap the home button to see the application you are running.
4. Hold one of the application icons to quit the application.

Although it is great to move between application without reloading, it is a burden to close the application.

So after thinking about it, I suggest this workflow:
1. Launch an application
2. Launch another application, which will automatically quit the previously opened application.
3. If you want the application to keep running in the background, you double tap the home button.
3-1. You should see your current application with a lower opacity and a “+” icon.
3-2. You tap on the “+” icon to keep it running even if you go to the home screen or to another application.
4. Quitting the application should be the same way as in the current iOS 4,  except your currently running application won’t have a ” –” icon. (current iOS 4 doesn’t show the icon of current application.)

Here’s a quick mockup to give you visual sense of the flow…
What do you think?

This slideshow requires JavaScript.

iTunes Korean Translation

I finally got an iPhone 4 today and was syncing my phone to get my backup.
Despite the fact that iPhone became pretty popular in South Korea, I saw this weird translation from English to Korean.

Apple should pay attention to translations! “이따금”(occasionally in English) is rarely used by actual Koreans! If you can’t find a good Korean translator, I can recommend you some.